
Stock data, app and API
Market Data Meets Alternative Intelligence
Prices, sentiment, filings and AI signals for the most-watched US stocks. Read them in our app, hand them to your AI, or build on them with one API key.
PRO: 55% off for life with FALL26. $6.75 a month. Plans and pricing
API free to try, no card. See a live stock reading →
Sample values. Each row is a field the stocks API returns.
https://app.sentisense.ai/mcpAdd it as a connector, sign in, ask about any stock.
Classical Financial Data
- ▸Intraday (15-minute delayed) and historical stock prices (OHLCV)
- ▸Company fundamentals, profiles and reported financial statements
- ▸Analyst ratings, price targets and consensus history
- ▸Earnings calendar, and results ranked by surprise with the price reaction after each report
Alternative Data
- ▸News sentiment from 200+ curated publishers
- ▸Social signals from Reddit, X, Substack and finance YouTube
- ▸AI-clustered story narratives with impact scoring
- ▸A reliability score per publisher, alongside each document's sentiment
Institutional Intelligence
- ▸SEC 13F institutional flows, by quarter and filer
- ▸Form 4 insider trades, with cluster buys flagged
- ▸Filer types from index funds and hedge funds to activists, pensions and banks
- ▸Congressional STOCK Act disclosures, with the filing delay
AI-Powered Insights
- ▸Detected changes per stock: insider clusters, flow reversals, unusual volume
- ▸A daily A to F rating across seven dimensions, with the weakest one named (API and MCP)
- ▸The expected move a stock’s own option chain implies into earnings
- ▸A curated graph of the people, products and peers behind each ticker
One question,
four ways in
Ask your AI a market question and it answers from SentiSense data, with the filings behind it. Then build on the same data yourself.
>are insiders buying $UBER?
Yes. In the 90 days to September 14, 2026, two insiders bought UBER on the open market. CEO Dara Khosrowshahi took 141,000 shares on September 10 at about $70.96, roughly $10.0M, and President and COO Andrew Macdonald took 70,000 shares on September 4, about $5.3M. Three purchases, 211,000 shares, $15.3M in total, outweighing the sales filed by other officers in the same window.
SEC Form 4 filings, read 2026-09-14
MCP connector
One URL into Claude, ChatGPT, Grok or Codex. OAuth, read-only.
API docs
Every endpoint, its parameters and a worked example. One key, JSON.
Agent skills
Playbooks your coding agent installs and reads. One command.
SDKs
Python and Node wrappers around the same endpoints.
Free tier, no card. npx skills add SentiSenseApp/skills wires a coding agent in one command.
Sentiment, Scored and Sourced
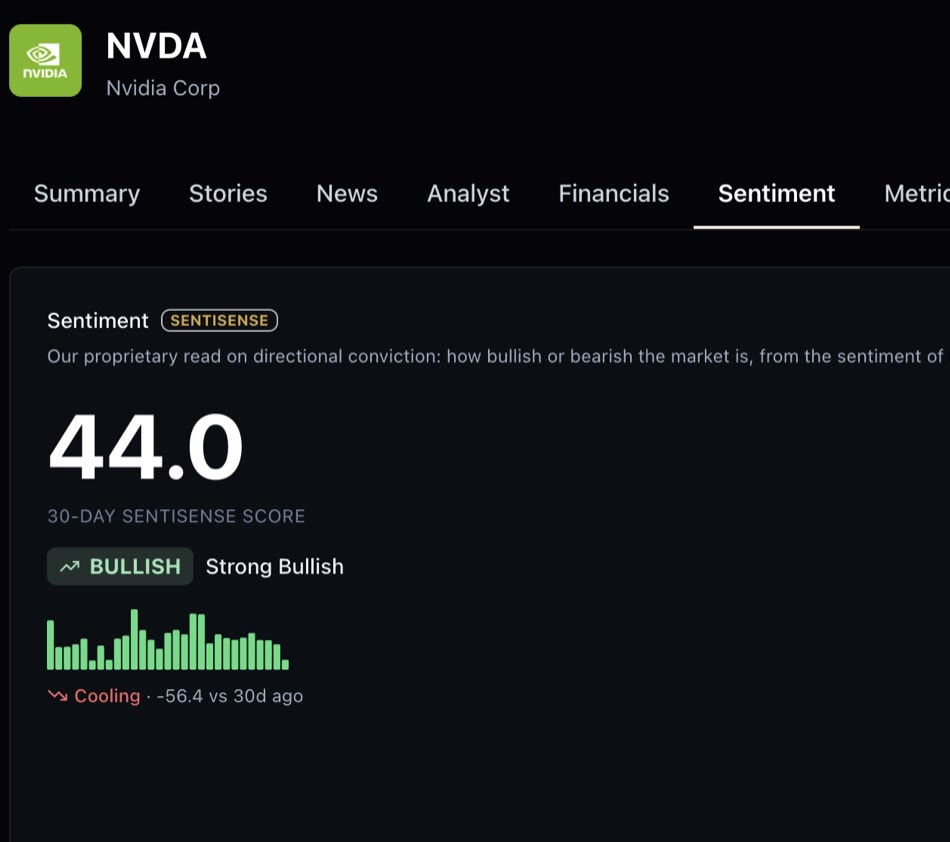
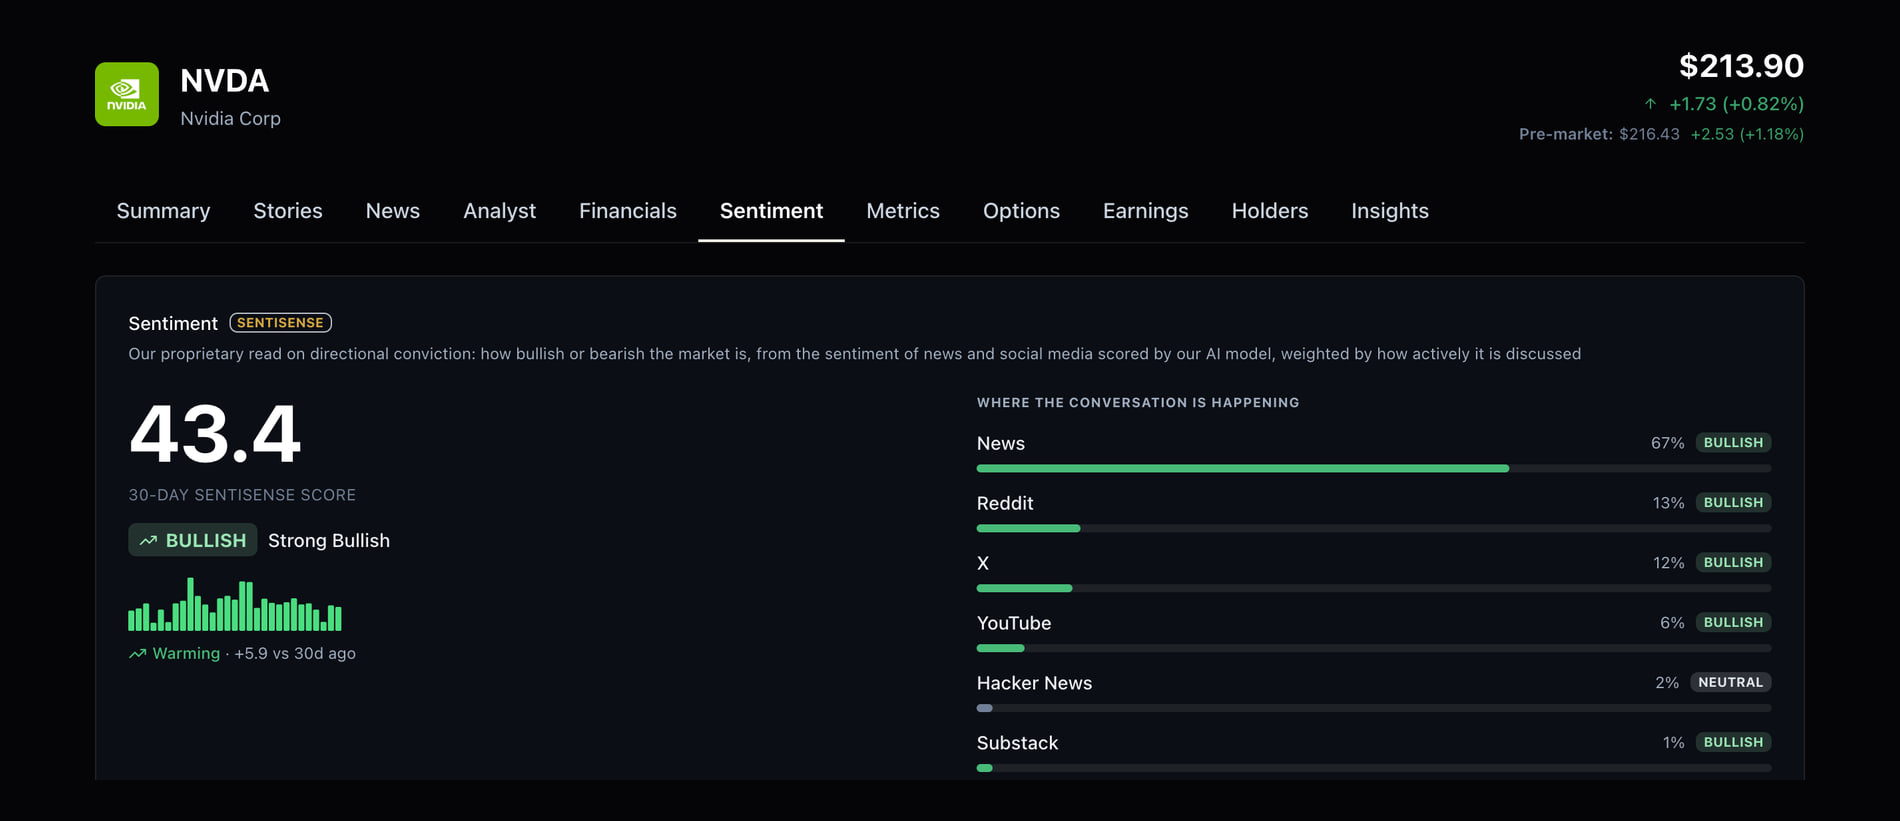
The SentiSense Score reads the conversation around a stock: how bullish or bearish it is across news and social media, weighted by how actively it is being discussed. Every reading carries its direction label, its move against a month ago, and where the conversation is happening.
- ▸ A 30-day Score per stock, with its trend
- ▸ The source mix behind it: news, Reddit, X, YouTube, Substack
- ▸ The daily bullish, neutral and bearish split underneath
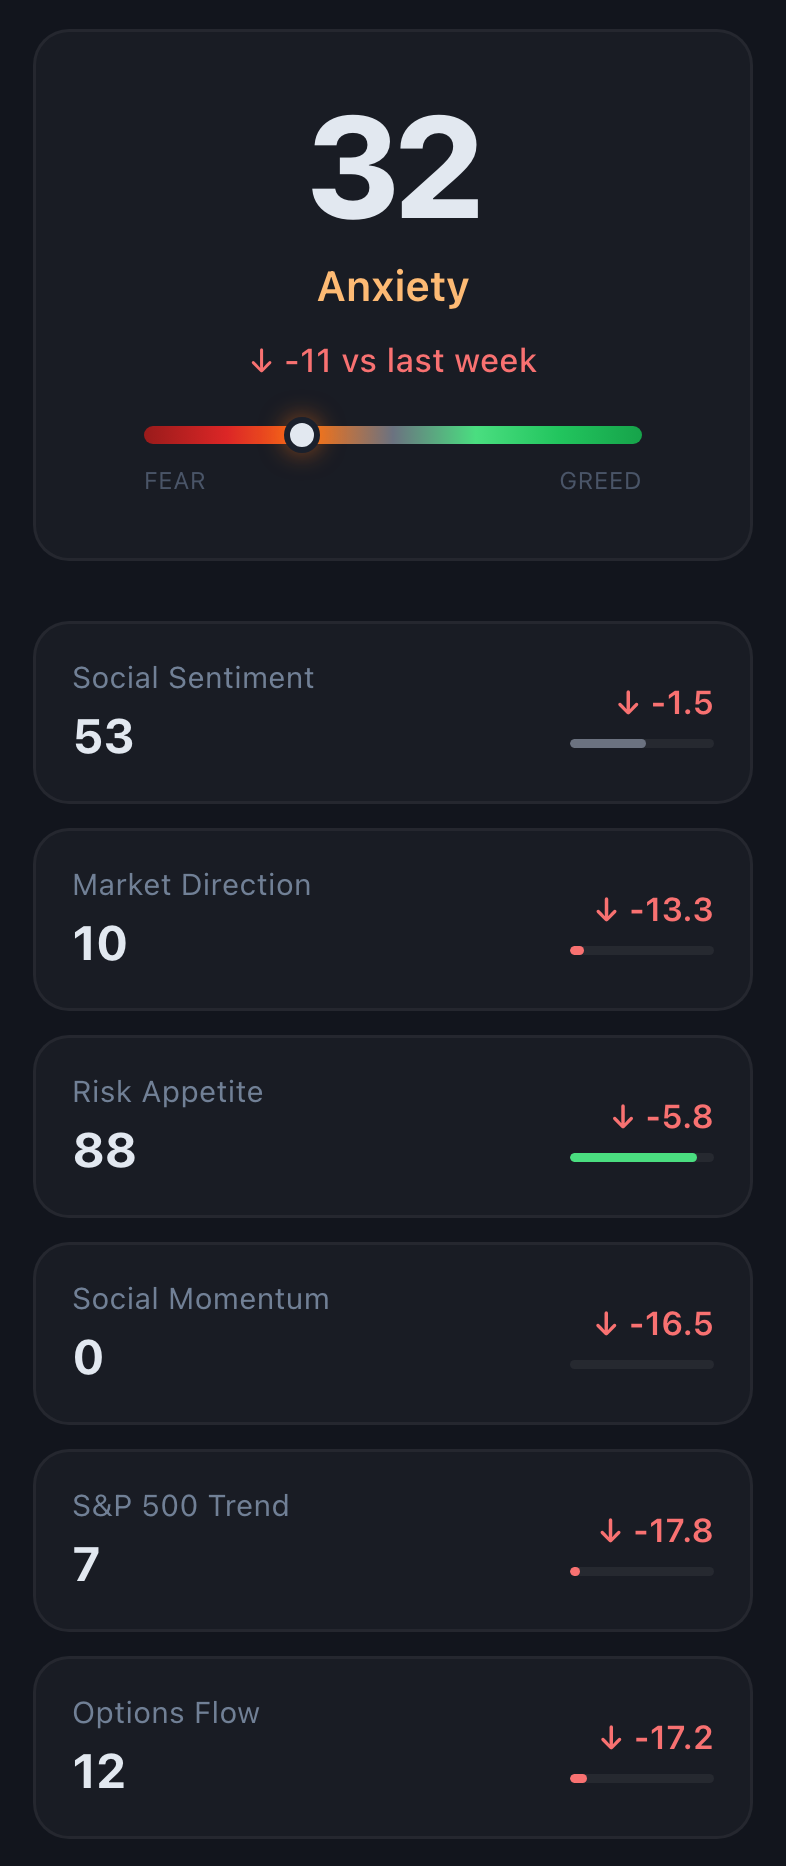
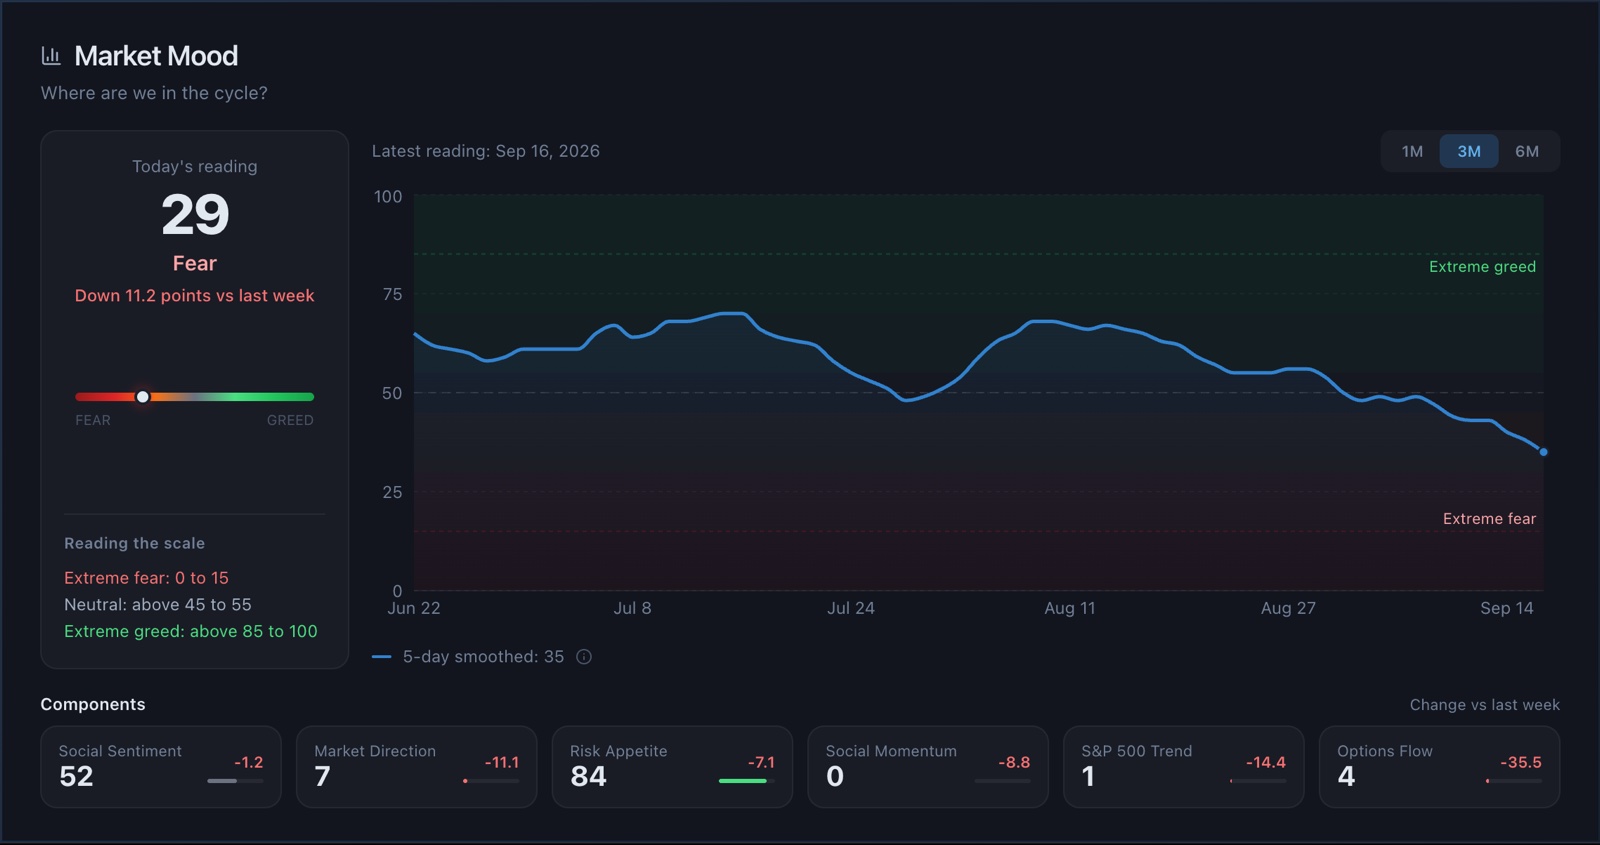
Market Mood: Our Fear & Greed Index
One 0 to 100 reading for the whole market, rebuilt daily from six components we compute ourselves: social sentiment, market direction, risk appetite, social momentum, the S&P 500 trend, and options flow. Each one carries its own score and its change against last week, so you can see which component moved the gauge.
Free, no account needed, with one, three and six months of history.
Earnings, Ranked and Explained
A calendar tells you who reports. This tells you which reports mattered: each surprise against consensus sits beside the move the stock actually made.
Ranked, not listed. A written summary on the reports that earned one.
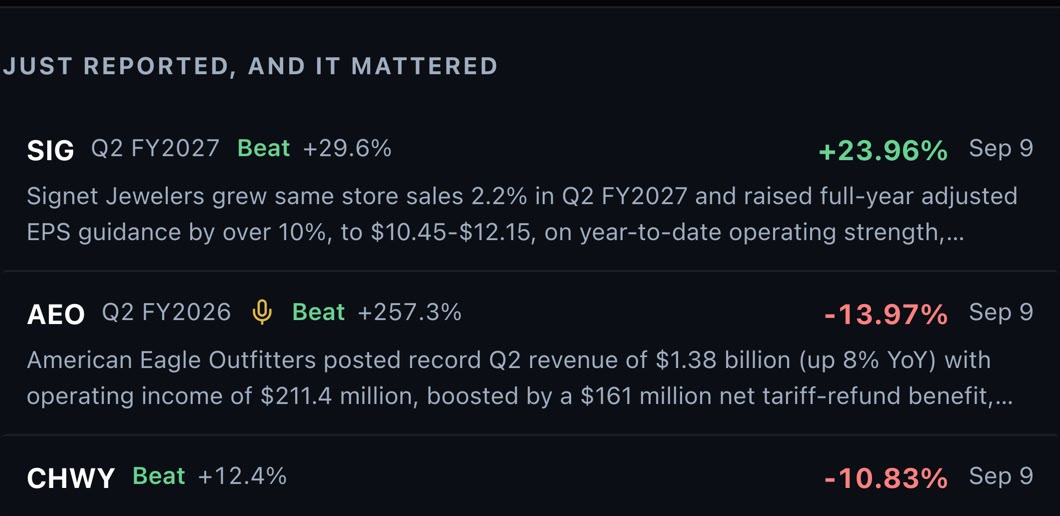
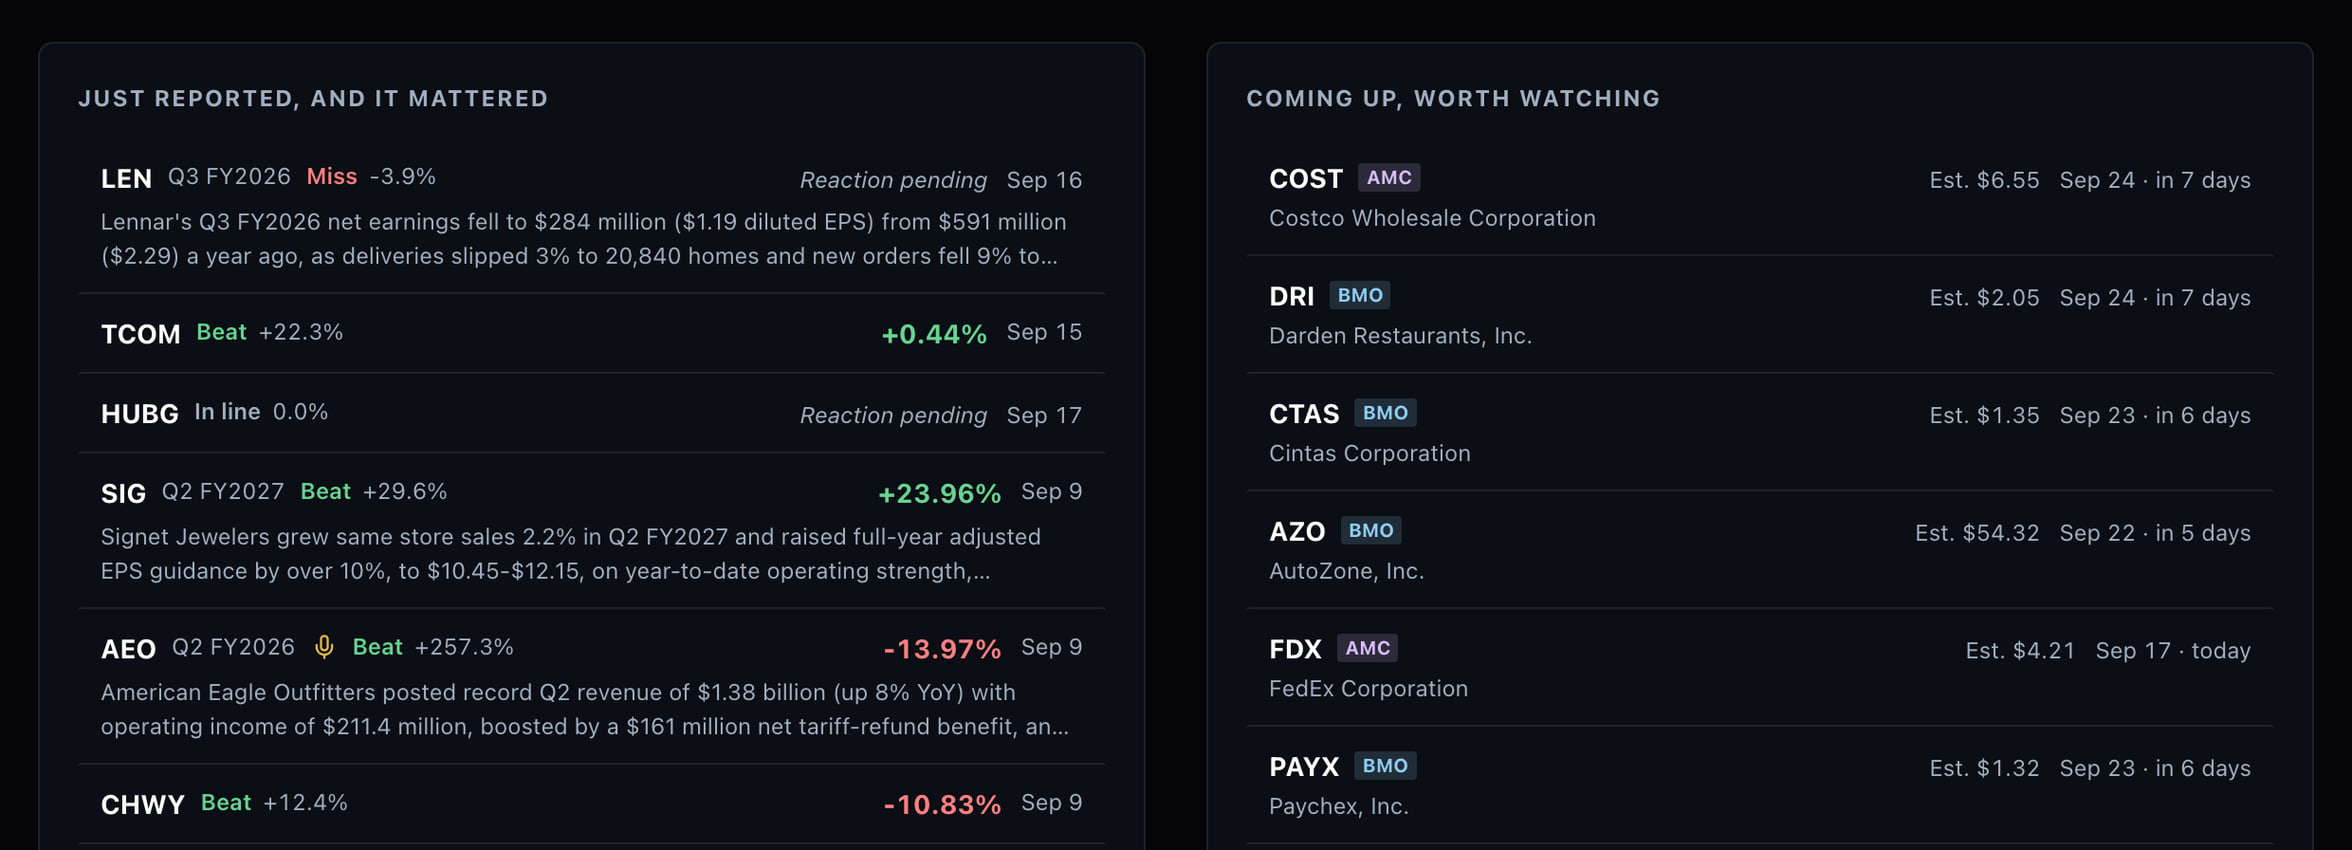
A beat is only a beat against an estimate, so we serve the estimates themselves: the analyst EPS consensus per ticker and how it has moved. Alongside it, the rating mix and price targets, tracked over time.
Ahead of a report, the stock's own option chain says how big a swing is being priced in. The options endpoint serves that expected move over one, five and twenty sessions, so you can hold it against the reaction that follows.
Screen the Market by Sentiment
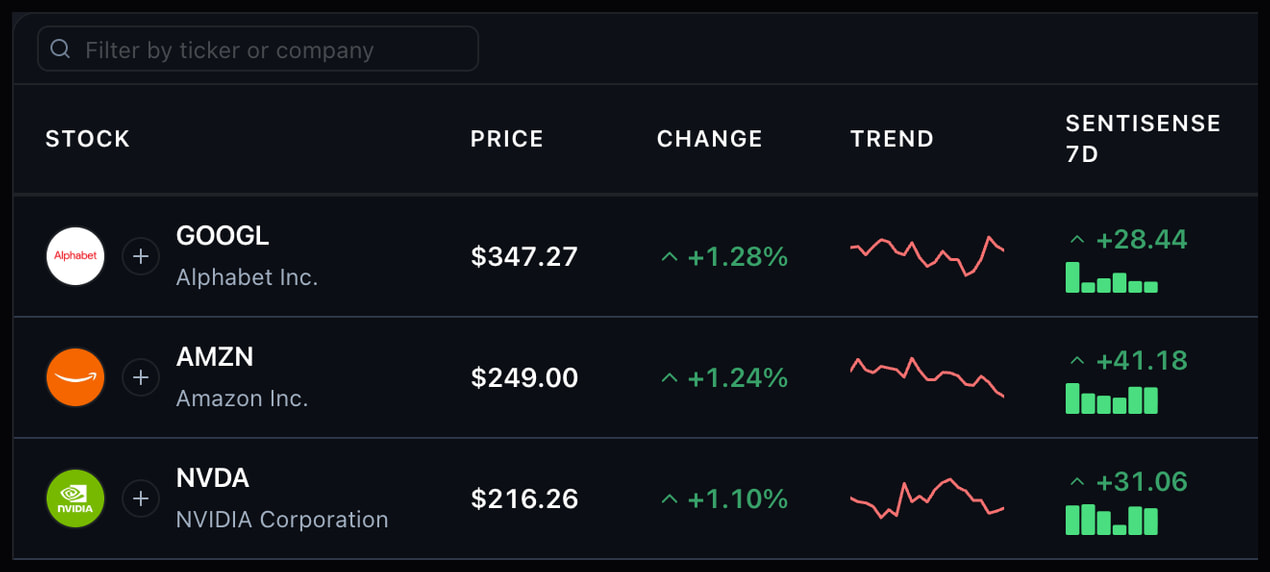
A stock and ETF screener built on crowd conviction, not just price. Start from one-click presets like Winners, Momentum, or Oversold + Bullish, then tweak the filters, save your screens, and rerun them anytime. Free with an account.
The SentiSense Score reads the conversation around a stock right now. Filter and sort on it next to price, volume and fundamentals.
Sentiment columns. One-click presets. Save and export.
AI Reports That Argue Both Sides
A report that only argues one way is a pitch. Ours run the bull case and the bear case on the same quarter, each one built from the filed numbers, and each one ending where its own argument gets uncomfortable.
- ▸ Both cases, with the evidence behind each
- ▸ The blind spots, stated rather than implied
- ▸ What each scenario would mean for the stock
Bull Case: AI Ad Engine Plus a New Subscription Revenue Stream
Advertising revenue reached $59.36 billion, up 27.5% YoY, on a 14% year-over-year increase in ad impressions and a 12% increase in average price per ad.
Key supporting points
- ▸Family of Apps revenue grew 28% YoY to $60.37 billion in Q2 2026, with advertising revenue up 27.5% to $59.36 billion, driven by AI ranking, creative automation, and campaign optimization tools
- ▸Ad impressions up 14% YoY and average price per ad up 12% YoY show Meta growing both volume and pricing at once, a combination few digital ad platforms sustain at this scale
Bear Case: Record Capex Meets a Margin Squeeze
R&D expense grew 67% YoY to $21.66 billion in Q2 2026, from $12.94 billion a year earlier, well ahead of the 28% revenue growth it is meant to fund
Key supporting points
- ▸Free cash flow fell to $784 million from $12.39 billion in Q1 2026 and from $8.55 billion in Q2 2025 (-91% YoY), as quarterly capital expenditures reached $30.12 billion
- ▸Consolidated operating income fell 8% YoY to $18.78 billion and net income fell 14% YoY to $15.85 billion, a year-over-year profit decline despite double-digit headline revenue growth
Simple, Transparent Pricing
Start free. PRO is 55% off for life with FALL26: $6.75 a month, or $64.80 billed yearly.
Get Started - 55% off for lifeFree $0/mo | PRO $6.75/mo$15/mo | |
|---|---|---|
| Stock prices, charts, fundamentals | Full access | Full access |
| SentiSense Score and sentiment metrics | Full access | Full access |
| Documents and news (sentiment metrics) | Full access | Full access |
| Stories list (titles + sentiment) | Full access | Full access |
| Story detail (narrative, perspectives) | 20 views/mo | Unlimited |
| Stock and ETF screener (filters, saved screens) | Full access | Full access |
| Options Intelligence (radar board, dossiers, history) | Top-25 board, 10 full dossiers/mo, 1y history | Full data |
| Institutional flows | Preview (top 5) | Full data |
| Institutional holders | Preview (top 5) | Full data |
| Activist positions, bonds, options holdings | Preview (top 3) | Full data |
| Insider trading (Form 4) | Preview (top 5) | Full data |
| Politician trading disclosures (STOCK Act) | Preview (top 5) | Full data |
| AI stock summaries (basic) | Unlimited | Unlimited |
| AI stock summaries (deep) | 10 views/mo | Unlimited |
| Company KPIs (product metrics, segment revenue) | PRO only | Full data |
| MCP connector (Claude, ChatGPT, Grok, Codex) | Preview data | Full data |
| API requests / month (REST + MCP) | 1,000 | Unlimited |
| Rate limit | 30 req/min | 300 req/min |
- Stock prices, charts, fundamentalsFreeFull accessPROFull access
- SentiSense Score and sentiment metricsFreeFull accessPROFull access
- Documents and news (sentiment metrics)FreeFull accessPROFull access
- Stories list (titles + sentiment)FreeFull accessPROFull access
- Story detail (narrative, perspectives)Free20 views/moPROUnlimited
- Stock and ETF screener (filters, saved screens)FreeFull accessPROFull access
- Options Intelligence (radar board, dossiers, history)FreeTop-25 board, 10 full dossiers/mo, 1y historyPROFull data
- Institutional flowsFreePreview (top 5)PROFull data
- Institutional holdersFreePreview (top 5)PROFull data
- Activist positions, bonds, options holdingsFreePreview (top 3)PROFull data
- Insider trading (Form 4)FreePreview (top 5)PROFull data
- Politician trading disclosures (STOCK Act)FreePreview (top 5)PROFull data
- AI stock summaries (basic)FreeUnlimitedPROUnlimited
- AI stock summaries (deep)Free10 views/moPROUnlimited
- Company KPIs (product metrics, segment revenue)FreePRO onlyPROFull data
- MCP connector (Claude, ChatGPT, Grok, Codex)FreePreview dataPROFull data
- API requests / month (REST + MCP)Free1,000PROUnlimited
- Rate limitFree30 req/minPRO300 req/min
PRO is $15/mo list. The code FALL26 takes 55% off for as long as you stay subscribed: $6.75 a month, or $64.80 billed yearly, which works out to $5.40 a month.
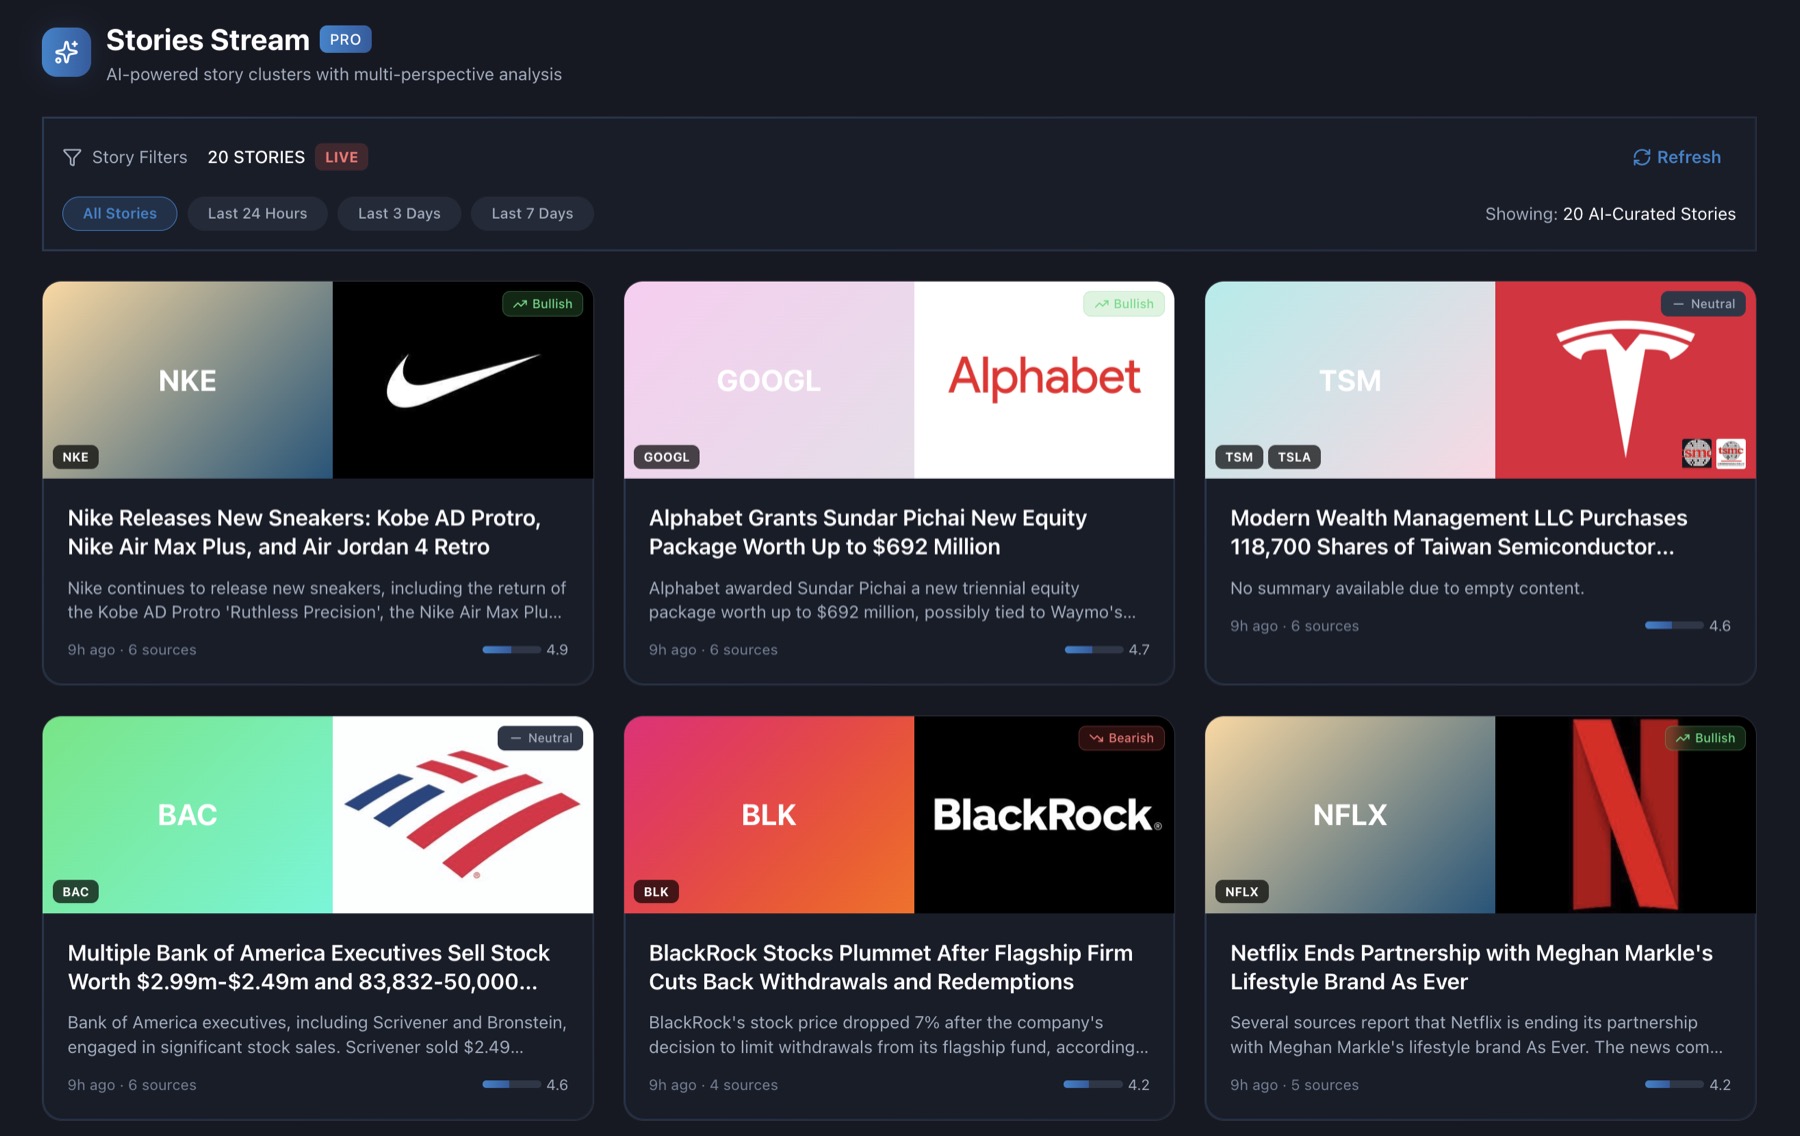
One card, closer

News That Moves Markets
One event, a pile of near-identical articles. We fold them into one story: what happened, how much it matters, how each publisher framed it, and which companies it touches.
- ▸ Every source in the cluster, with its own tone
- ▸ An impact score, 0 to 10, per story
- ▸ The companies and themes behind it
The ontology underneath
Signals That Connect the Dots
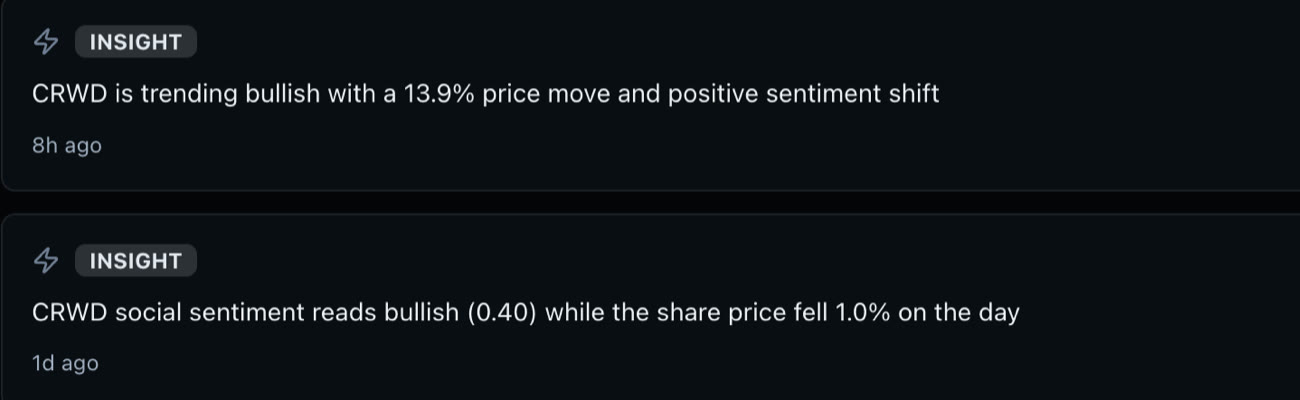
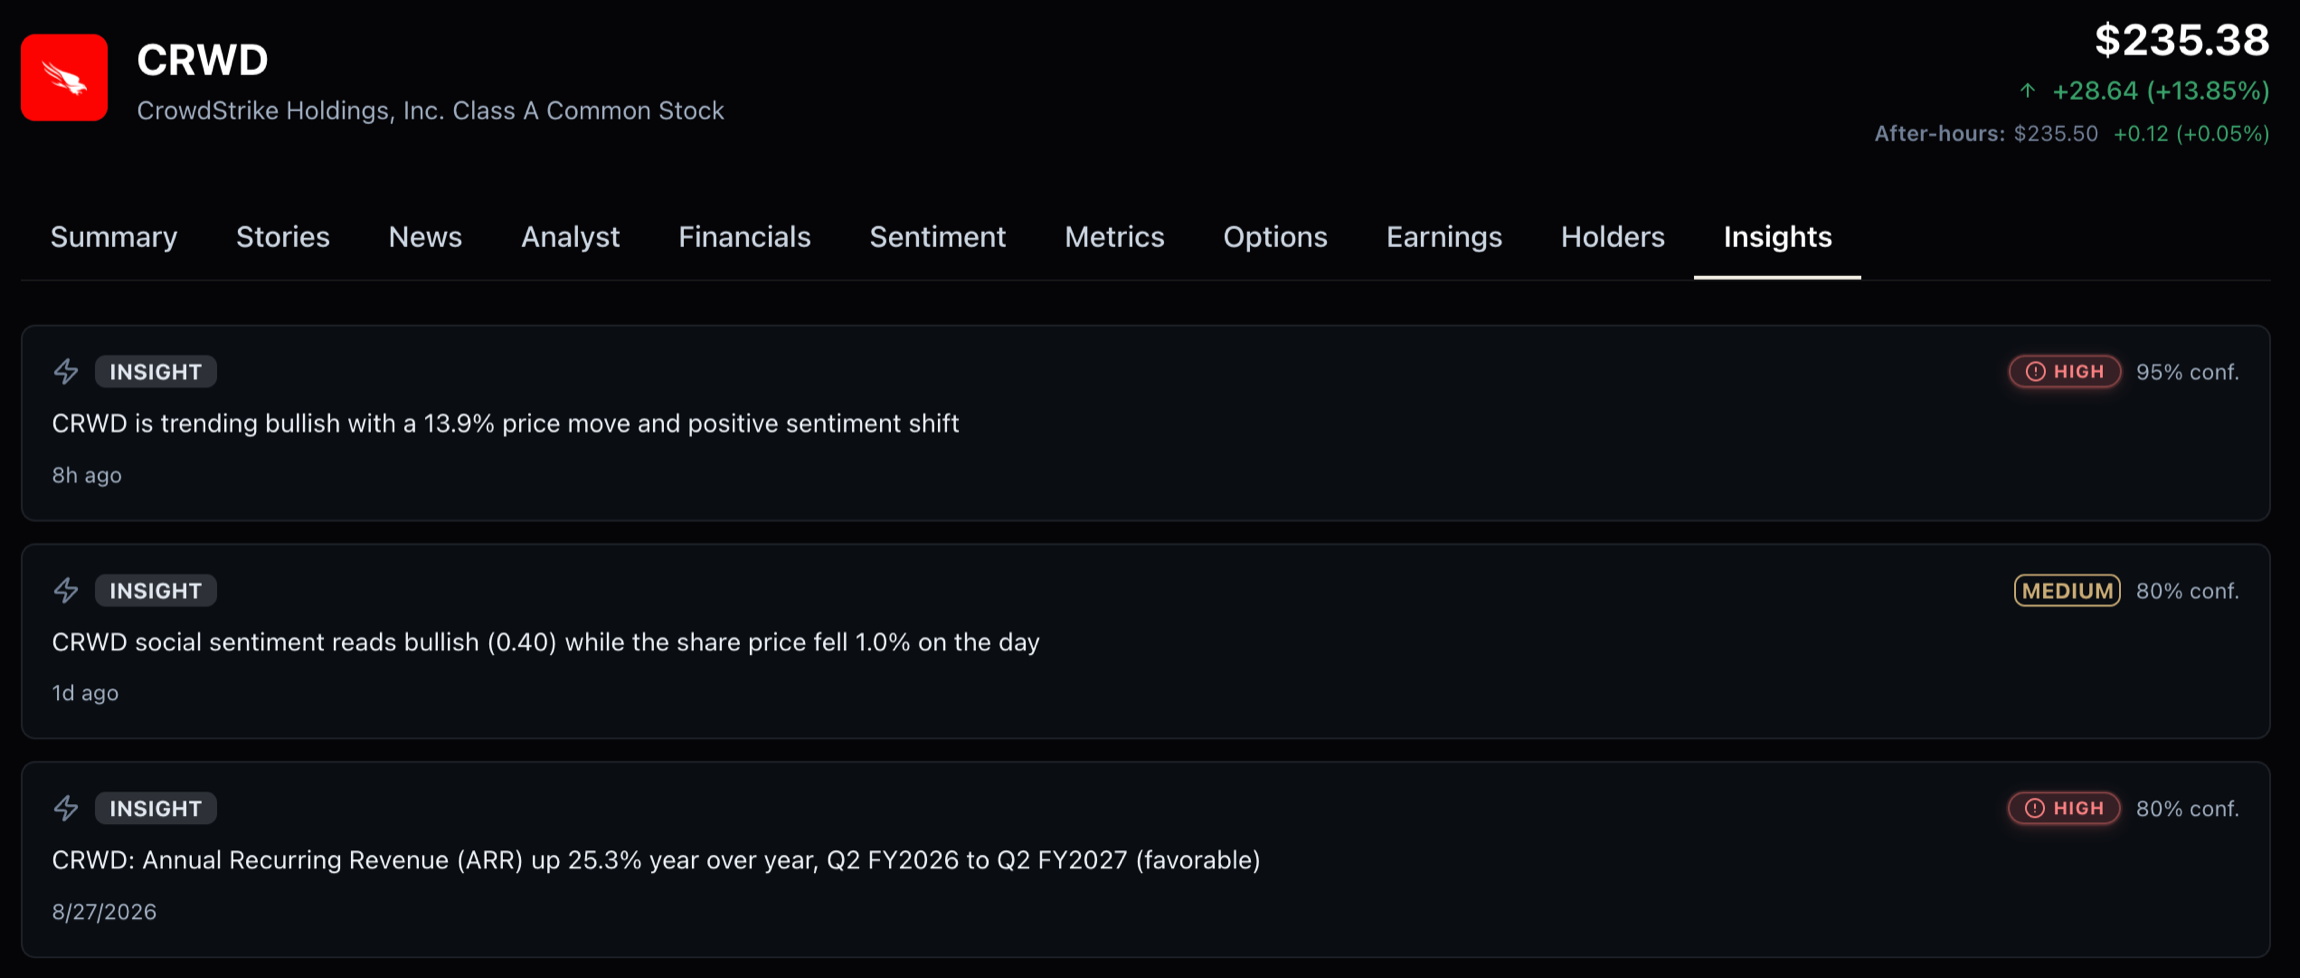
A signal is a change we detected and can show our work on: insiders buying in a cluster, a fund unwinding a position, sentiment pulling away from price, a growth rate turning. Each card says what changed, how confident we are, and how urgent it is.
- ▸ Insider clusters from SEC Form 4 filings
- ▸ Position changes from quarterly 13F data
- ▸ Readings against that stock's own baseline
- ▸ On PRO, set an alert and the same detection reaches you by email
An ontology under every signal
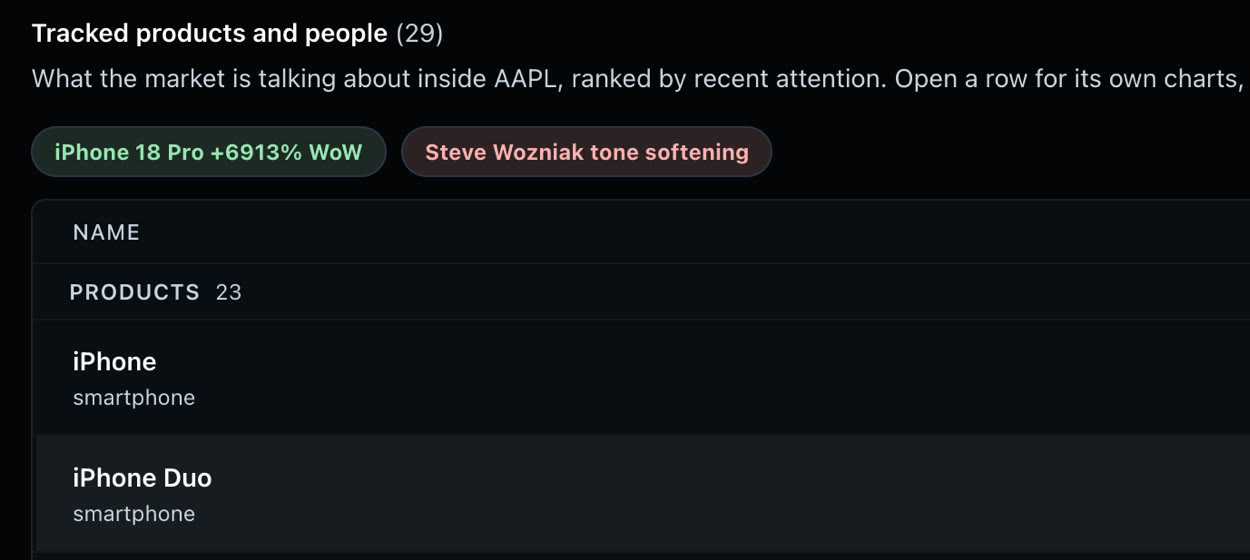
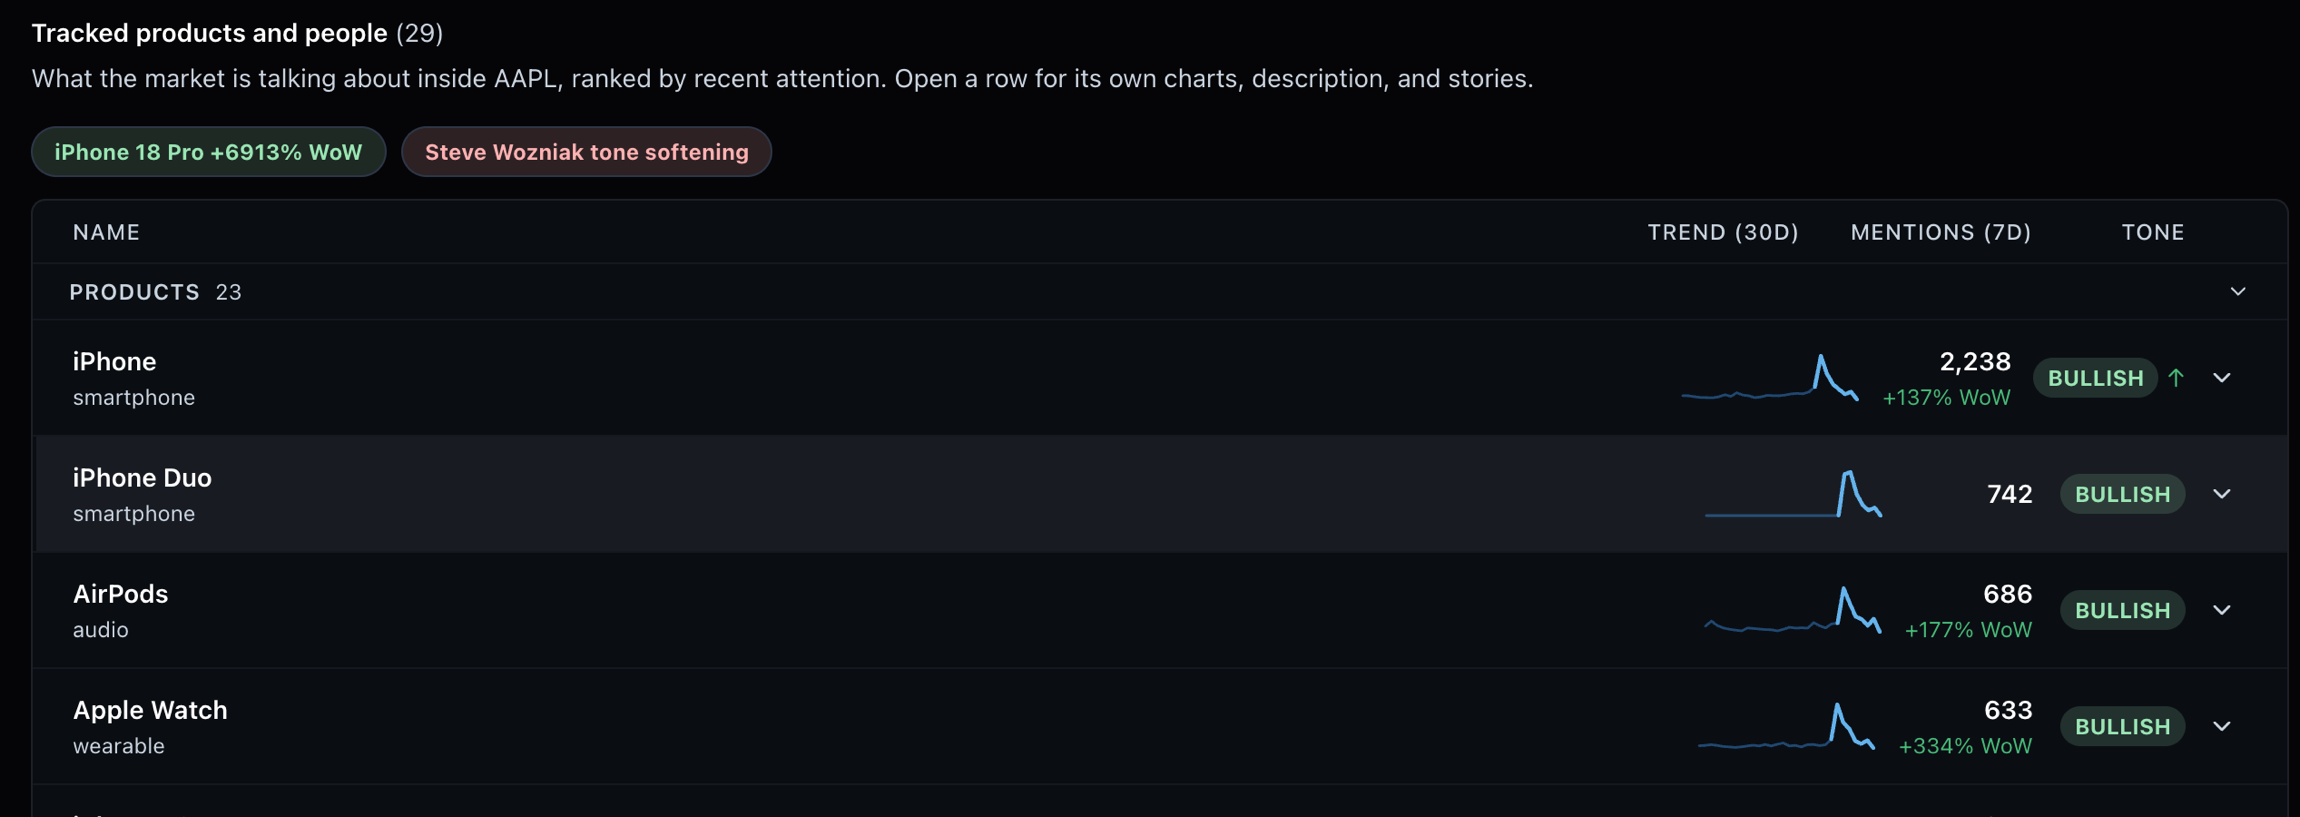
Each company here is more than a ticker: a curated ontology of its products, people, brands and peers. A post about the iPhone lands on Apple, a CEO's name lands on the company they run, and a rival's news reaches the names it affects. That same ontology is what an agent reads when it asks who and what sits behind a ticker.
Reported quarterly · 13F
Filed within days · Form 4
See What Institutions Are Buying
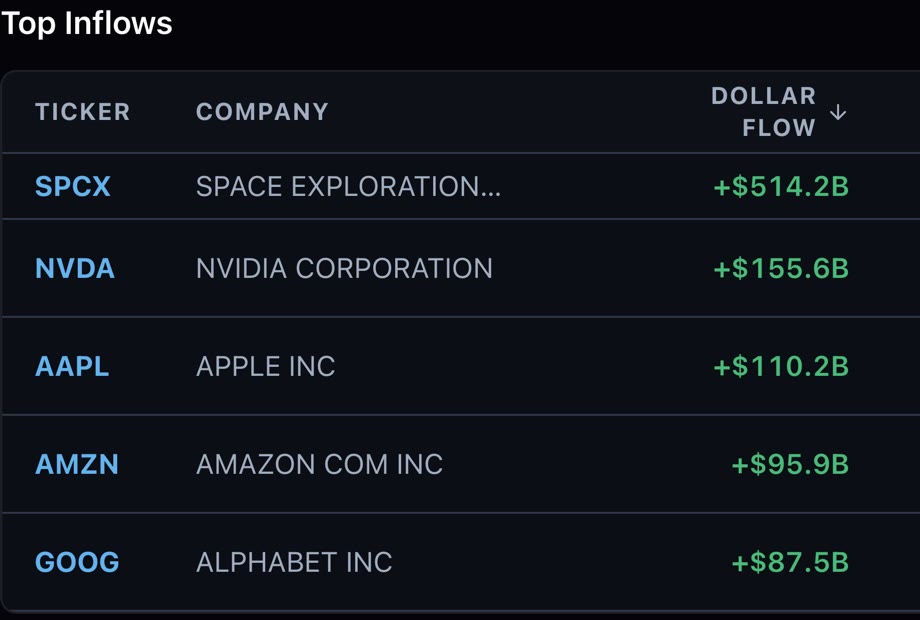
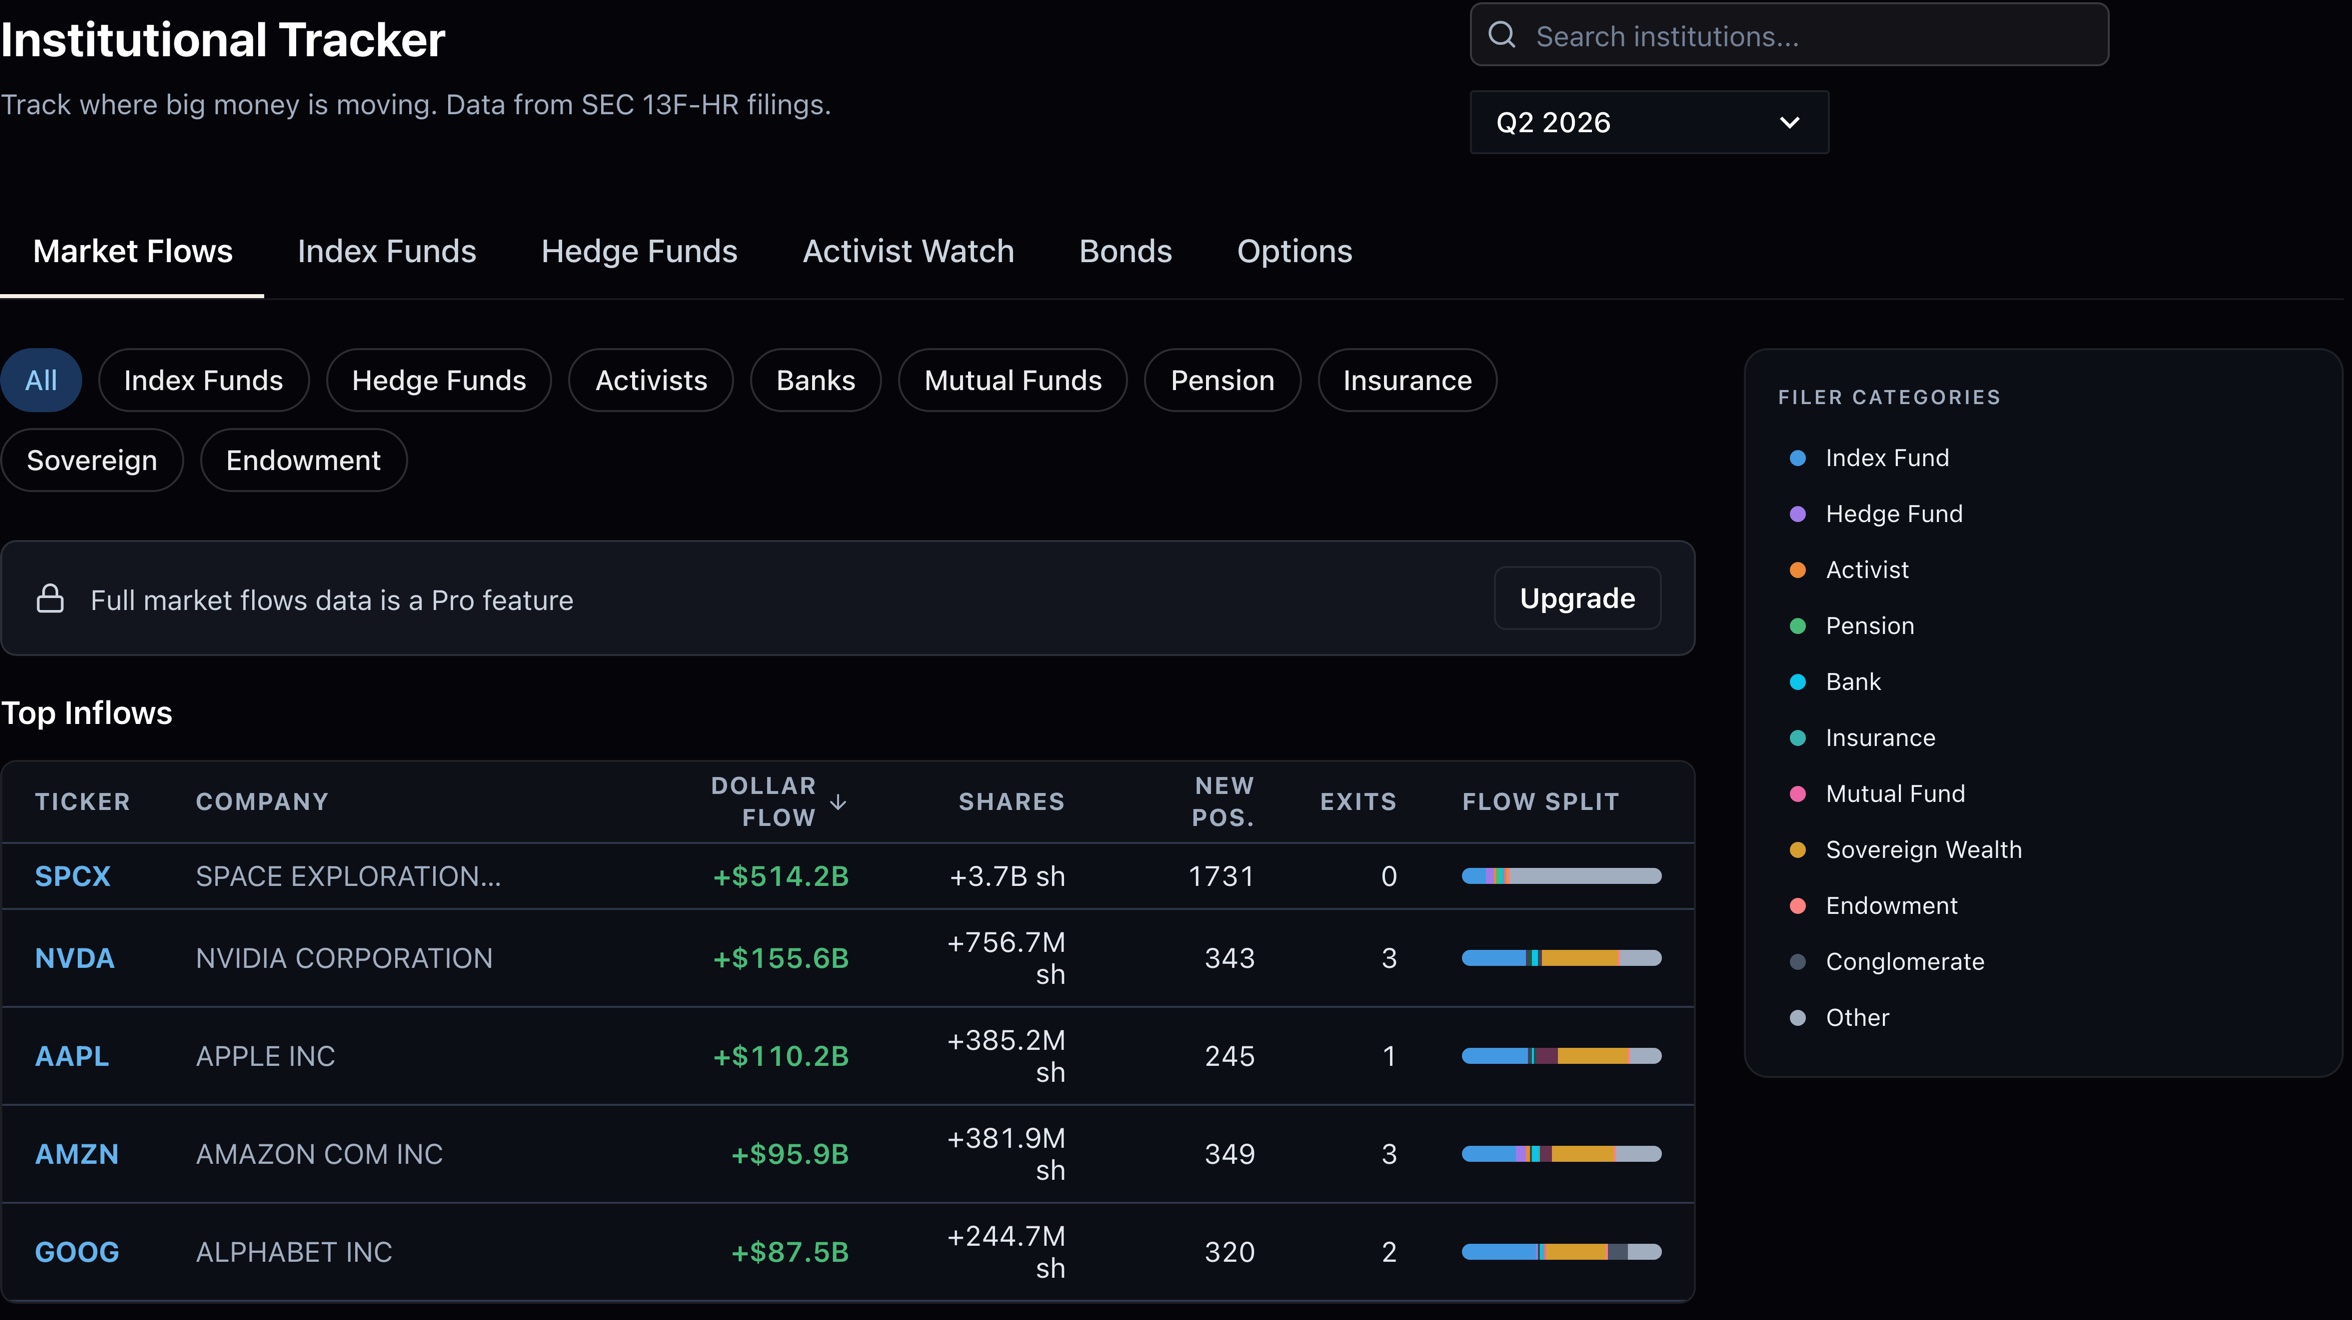
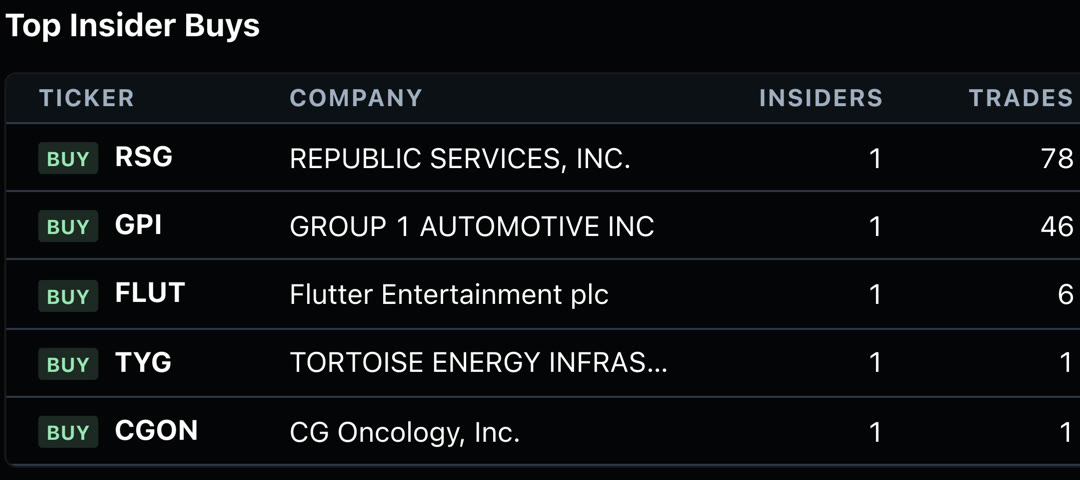
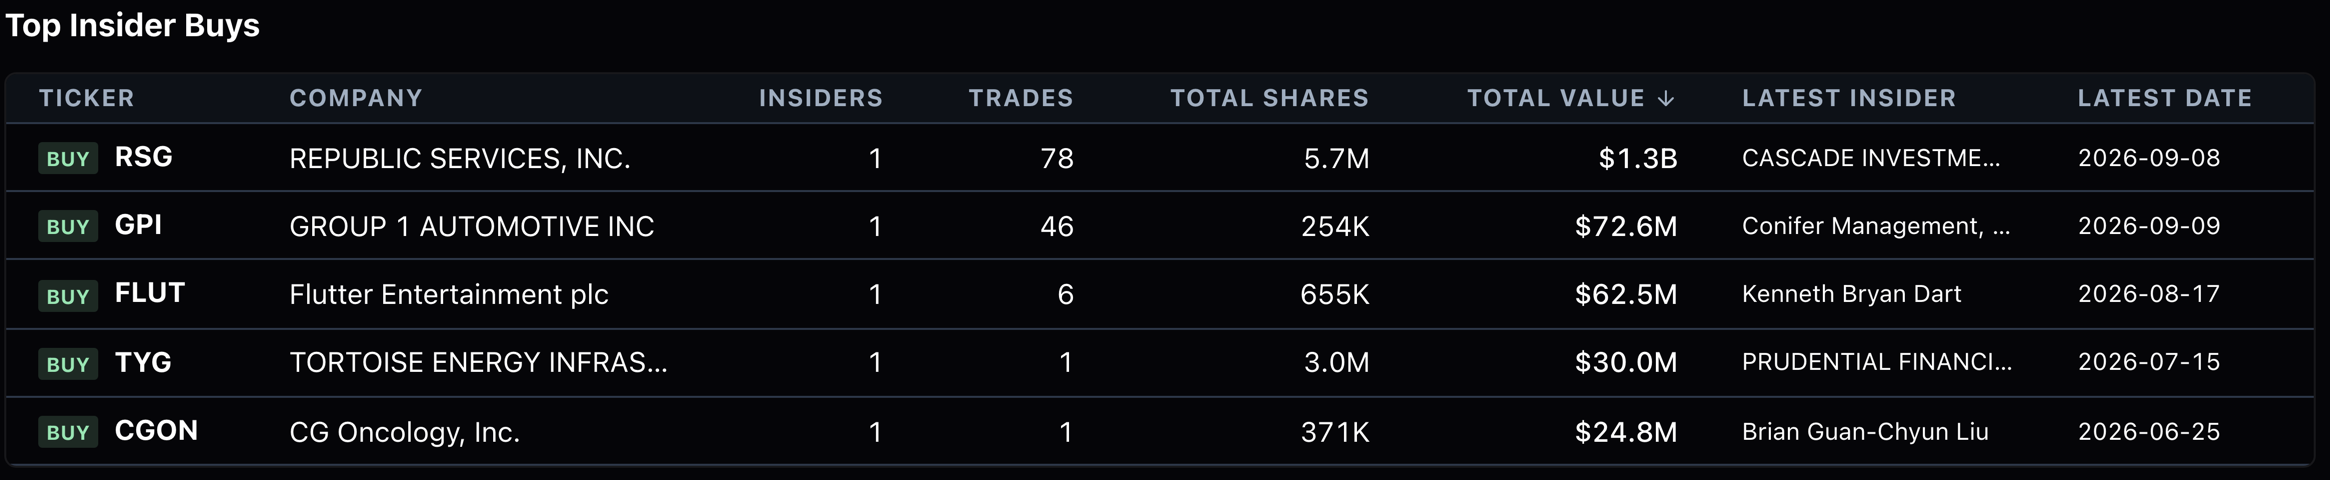
Two clocks, both useful. Institutional holdings are reported quarterly, so the tracker shows which positions grew or shrank in the last filed quarter, and which kind of filer moved them. Insider trades are filed within days, so Form 4 activity is close to current, with cluster buys flagged when several insiders at one company buy inside the same window.
- ▸ Position increases and decreases, by filer
- ▸ Filer types from index funds to activists
- ▸ Officers, directors and 10% owners, by name
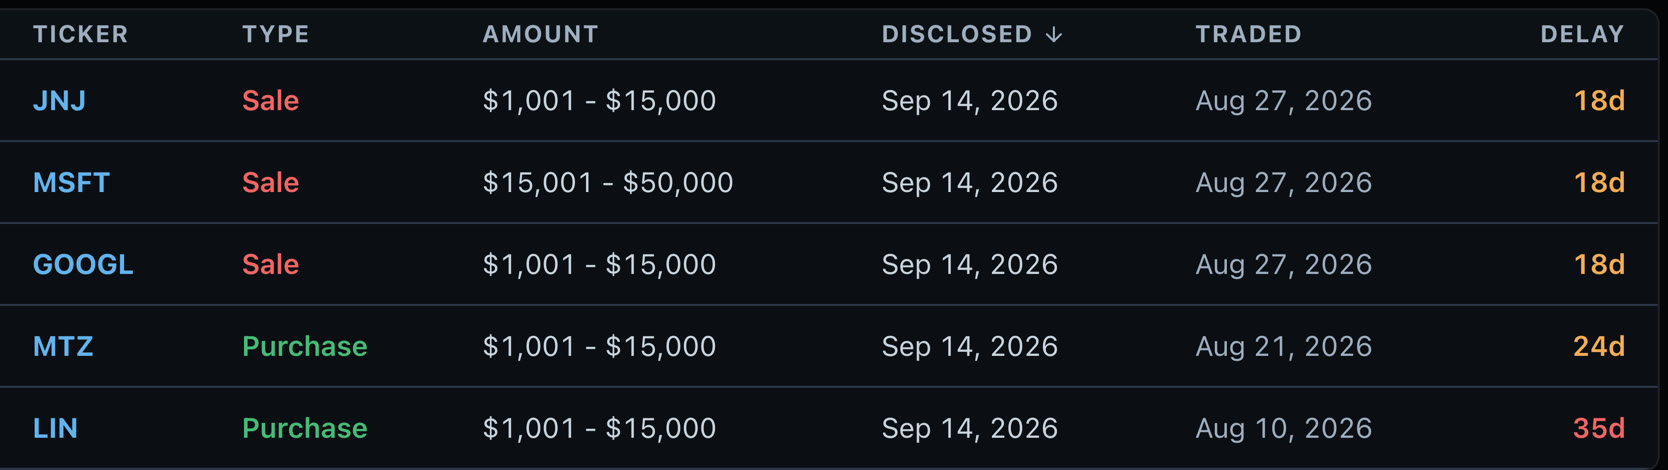
Track What Congress Is Trading
Members of Congress disclose their trades under the STOCK Act, often weeks after making them. We publish each disclosure with the trade date, the filing date and the gap between them, filterable by chamber, party, state or ticker.
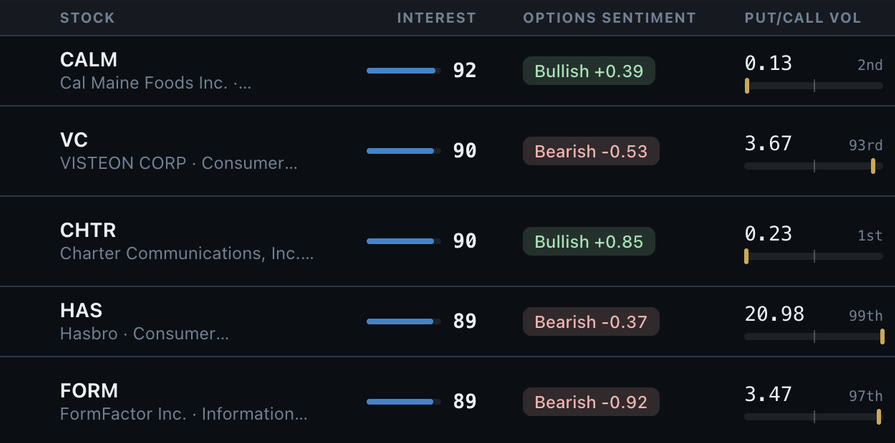
See Which Options Look Unusual Today
A market-wide leaderboard of options activity across the most-watched US stocks, plus the same readings on every ETF we track, so the macro hedges (SPY, QQQ, GLD, TLT, the sector funds) are covered too. Every reading, IV rank, put/call volume, skew, is ranked against that ticker's own history, so a 95th percentile means unusual for that name. Updated daily from the last completed session. Free in the app with an account: the top-25 board and ten full dossiers a month; PRO opens the full board and history.
Daily leaderboard. Implied range fan. Open-interest walls and max pain.
Over a million
documents a month
The pipeline reads 200+ curated publishers, finance subreddits, X, YouTube channels and Substacks. Each document is scored and linked to the companies it mentions, then served through the same app and API.
Measured September 2026. Publisher count is the curated roster.
Explore News FeedBuild your own terminal.
Professional terminals price out almost everyone who trades their own money. With one key, the signals behind that desk are yours.
Free: 1,000 requests a month, no card. PRO with FALL26: 55% off for life, $6.75 a month, unlimited requests.