Can AI Build a Real DCF Model? We Valued META Live with Claude to Find Out
An AI can write discounted-cash-flow math all day. What it cannot do is remember what a company actually earned. We connected Claude to reported financials and built a three-scenario DCF on META, without the model inventing a single number. Here is the full walkthrough.

Ask a modern AI to build you a discounted cash flow model and it will do it. It will lay out the projection years, discount the cash flows, compute a terminal value, and hand you a per-share number that looks entirely reasonable.
Then check the historicals it started from.
This is the part that keeps showing up in serious evaluations of AI financial modeling: the math is rarely the problem. The inputs are. Models produce statements where a line item is subtly wrong but the column still foots correctly, which is worse than an obvious error, because it survives the eyeball check. A model that is confidently wrong about last year's free cash flow will build you a beautiful, precise, useless valuation on top of it.
The fix is not a better prompt. It is to stop asking the model to remember, and start giving it the numbers to read.
So can AI build a real DCF? Yes, if you split the job correctly. This post walks through exactly that: connect Claude to reported financials, build a three-scenario DCF on META, and read what the result actually tells you. No spreadsheet, and no step where the model is guessing at history.
What we are actually building
A DCF has four moving parts:
- A free cash flow history. What the company has actually generated, for as many years as you can get.
- A growth assumption. What you think happens next. This is a judgment call and it should be yours, not the model's.
- A discount rate. What you demand for the risk.
- A bridge from enterprise value to equity value. Add cash, subtract debt, divide by shares.
Steps 2 and 3 are opinions. Steps 1 and 4 are facts, and facts are exactly what an AI should never be improvising. So we are going to source them.
Step 1: Connect the data
Add the SentiSense connector to Claude or ChatGPT. It is one URL and a sign-in, no code and no API key:
https://app.sentisense.ai/mcp
In Claude: Settings, then Connectors, add the URL as a custom connector, sign in. In ChatGPT you also need developer mode on first, and the settings area has since been renamed to Plugins. Full instructions in the connector docs.
The tool we care about here is get_financials. It returns reported income statement, balance
sheet and cash flow figures per fiscal quarter or per fiscal year, newest first, up to 40 quarters
or 20 years back, straight from what the company filed. The financial statements are available on
every tier, including Free.
Building an agent or a product instead of chatting? The same data shipped in the REST API today:
GET /api/v1/stocks/fundamentals/history takes ticker, timeframe (quarterly or annual), and
limit, and returns the same statements as JSON. Everything in this post works over either
surface.
Step 2: Pull the history
For a DCF you want annual data, and you want as much of it as you can get. Ask plainly:
Pull ten years of annual financials for META. I want revenue, operating income, operating cash flow, and free cash flow.
Claude calls get_financials with an annual timeframe and comes back with the table (money in
millions, newest first, as filed):
| Fiscal Year | Revenue | Operating Income | Operating Cash Flow | Free Cash Flow |
|---|---|---|---|---|
| FY 2025 | 200,966 | 83,276 | 115,800 | 46,109 |
| FY 2024 | 164,501 | 69,380 | 91,328 | 54,072 |
| FY 2023 | 134,902 | 46,751 | 71,113 | 43,847 |
| FY 2022 | 116,609 | 28,944 | 50,475 | 19,044 |
| FY 2021 | 117,929 | 46,753 | 57,683 | 39,116 |
| FY 2020 | 85,965 | 32,671 | 38,747 | 23,632 |
| FY 2019 | 70,697 | 23,986 | 36,314 | 21,212 |
| FY 2018 | 55,838 | 24,913 | 29,274 | 15,359 |
| FY 2017 | 40,653 | 20,203 | 24,216 | 17,483 |
| FY 2016 | 27,638 | 12,427 | 16,108 | 11,617 |
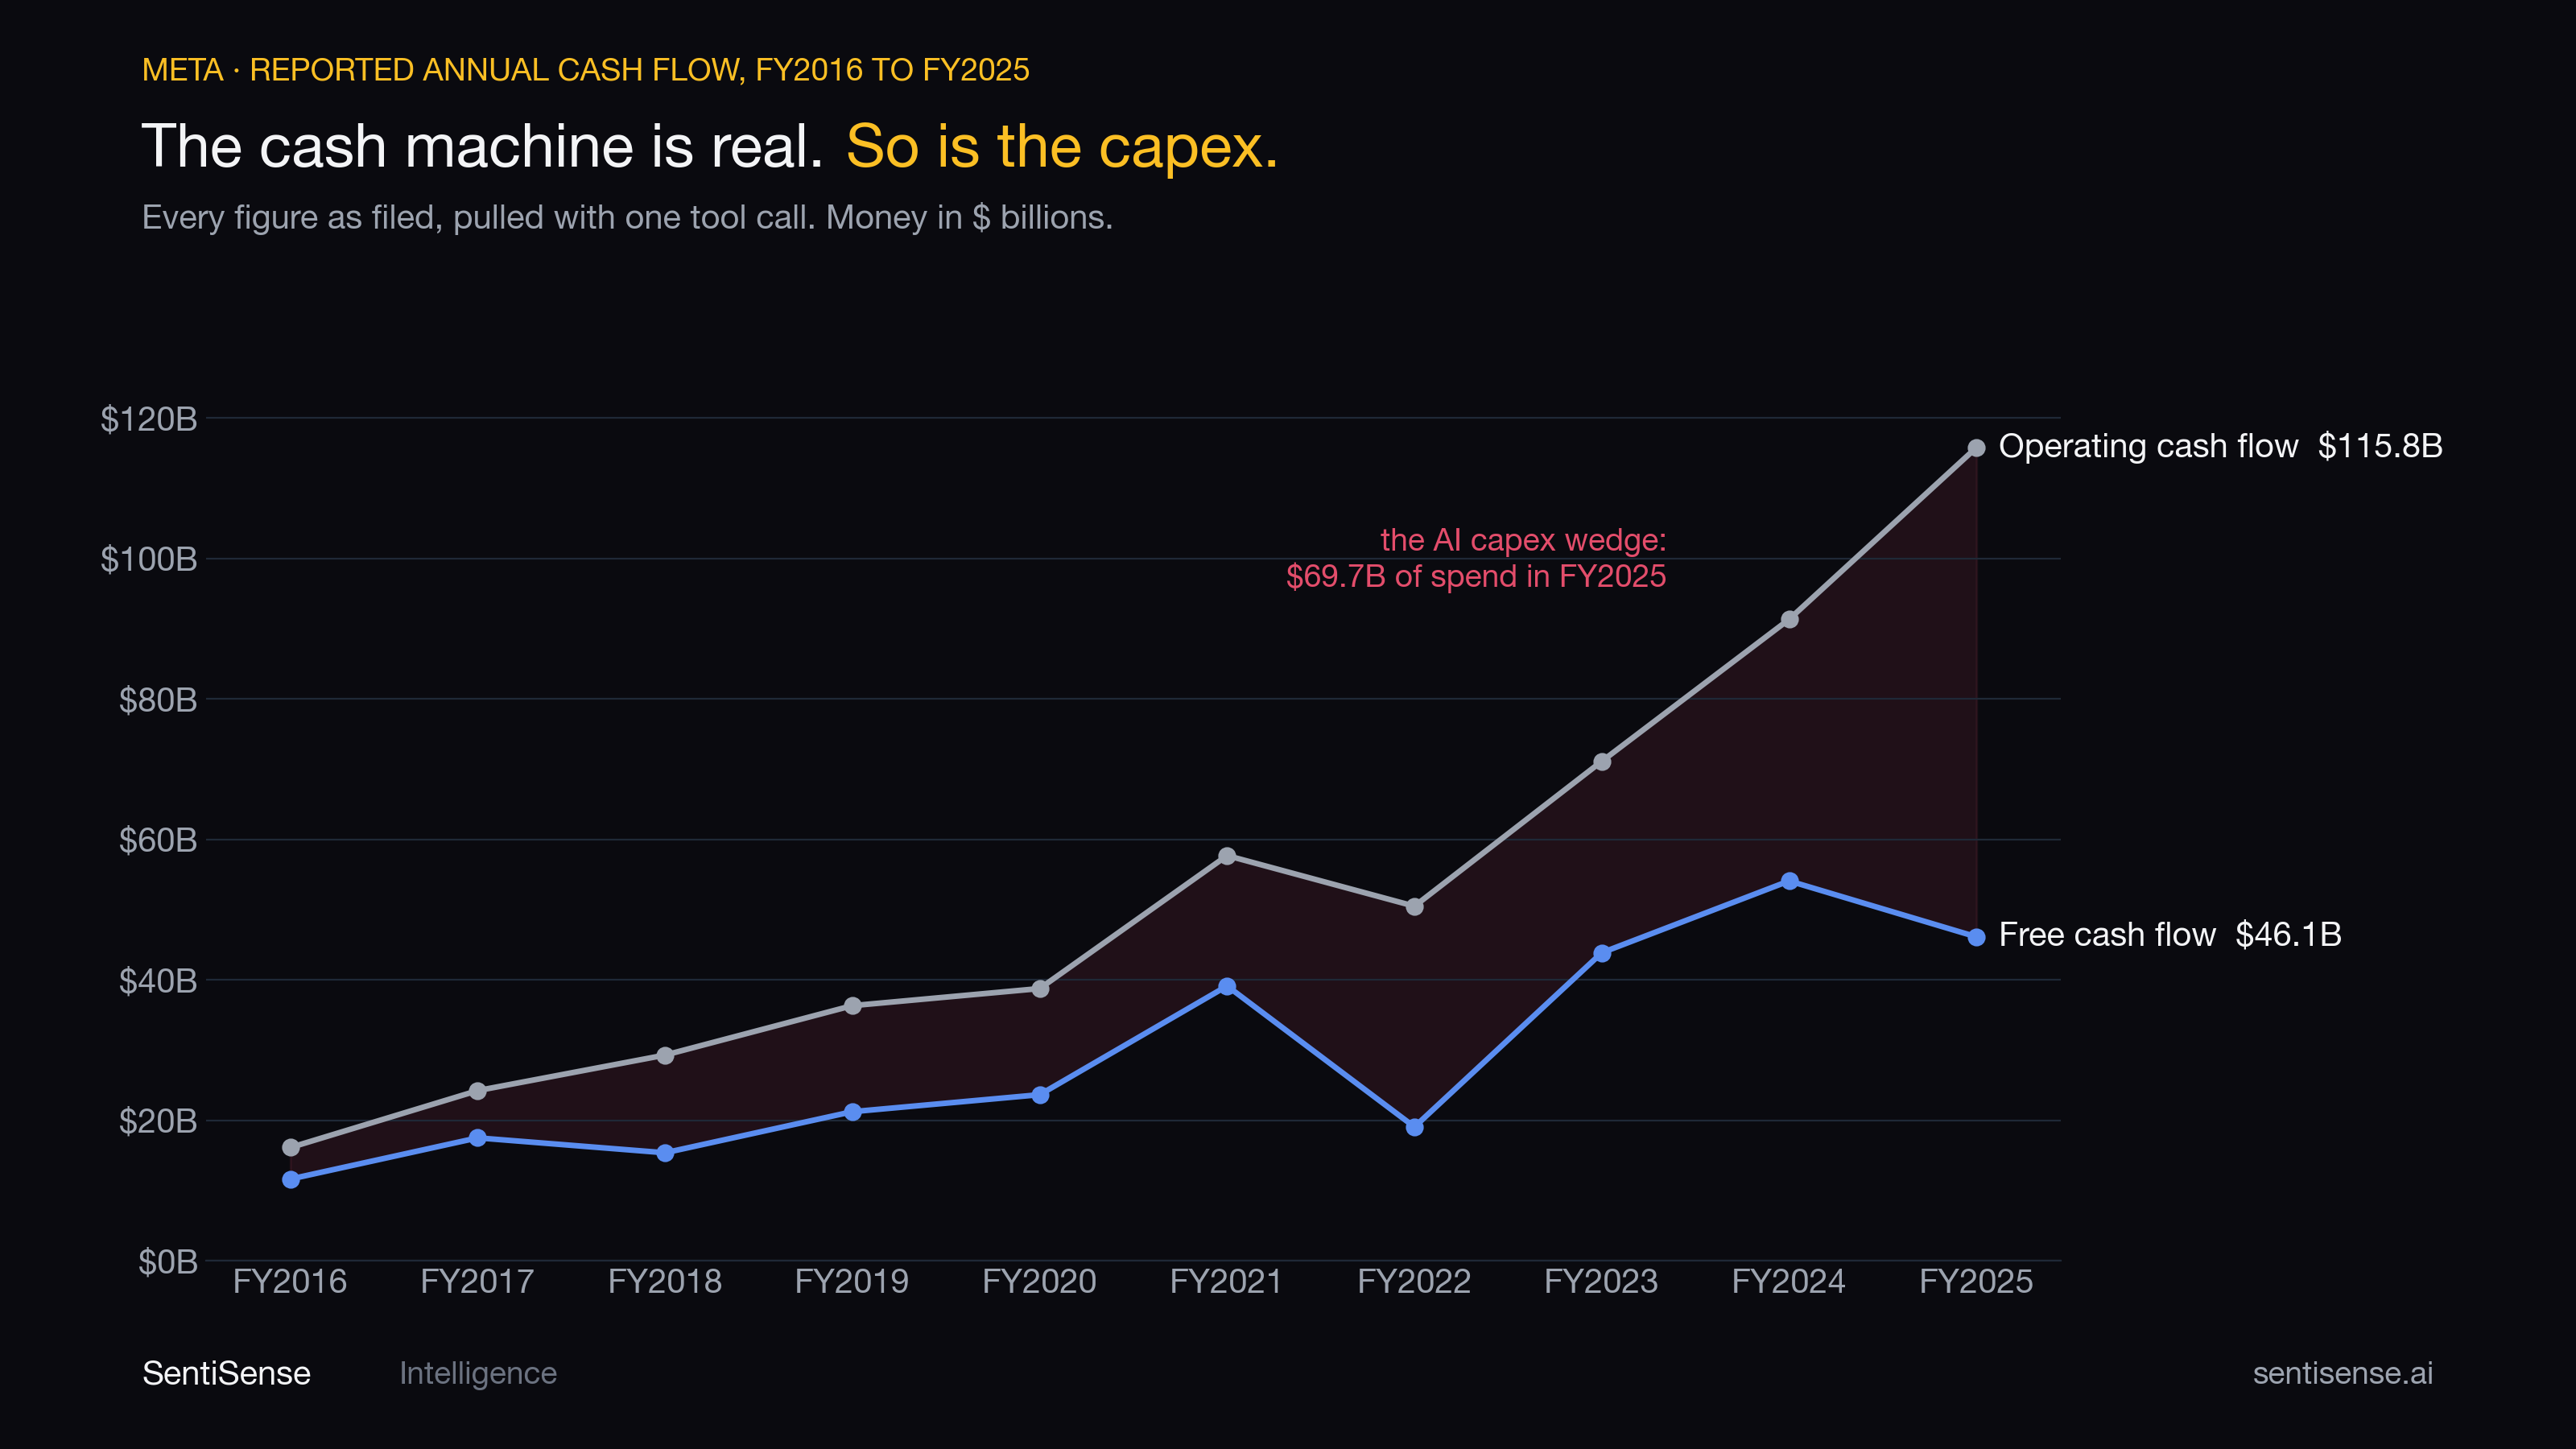
And the first honest read is right there in the last column. META's operating cash flow hit a record $115.8B in FY2025, but free cash flow fell, to $46.1B, because the company put roughly $70B into capex in a single year. That is the AI infrastructure buildout, visible in the filings:
Two things worth noticing before you go further, because they matter later and almost nobody checks them:
- These are fiscal periods, not calendar ones. For META they happen to align with the calendar year; for many companies they do not. Compare like windows.
- Free cash flow here is operating cash flow less capital expenditure. It is a GAAP-derived figure, before any adjustment you might want for leases, stock compensation, or, in META's case, the judgment call of whether today's capex is maintenance or a one-time buildout. That judgment is precisely what the scenarios below are for.
Step 3: Build three futures, not one forecast
A single DCF on a company mid-buildout is a coin flip. The honest move is to make the disagreement explicit: ask for three scenarios, and flag every assumption as yours.
Using only the free cash flow figures you just pulled, build a 10-year DCF for META, three ways. These assumptions are mine, not yours:
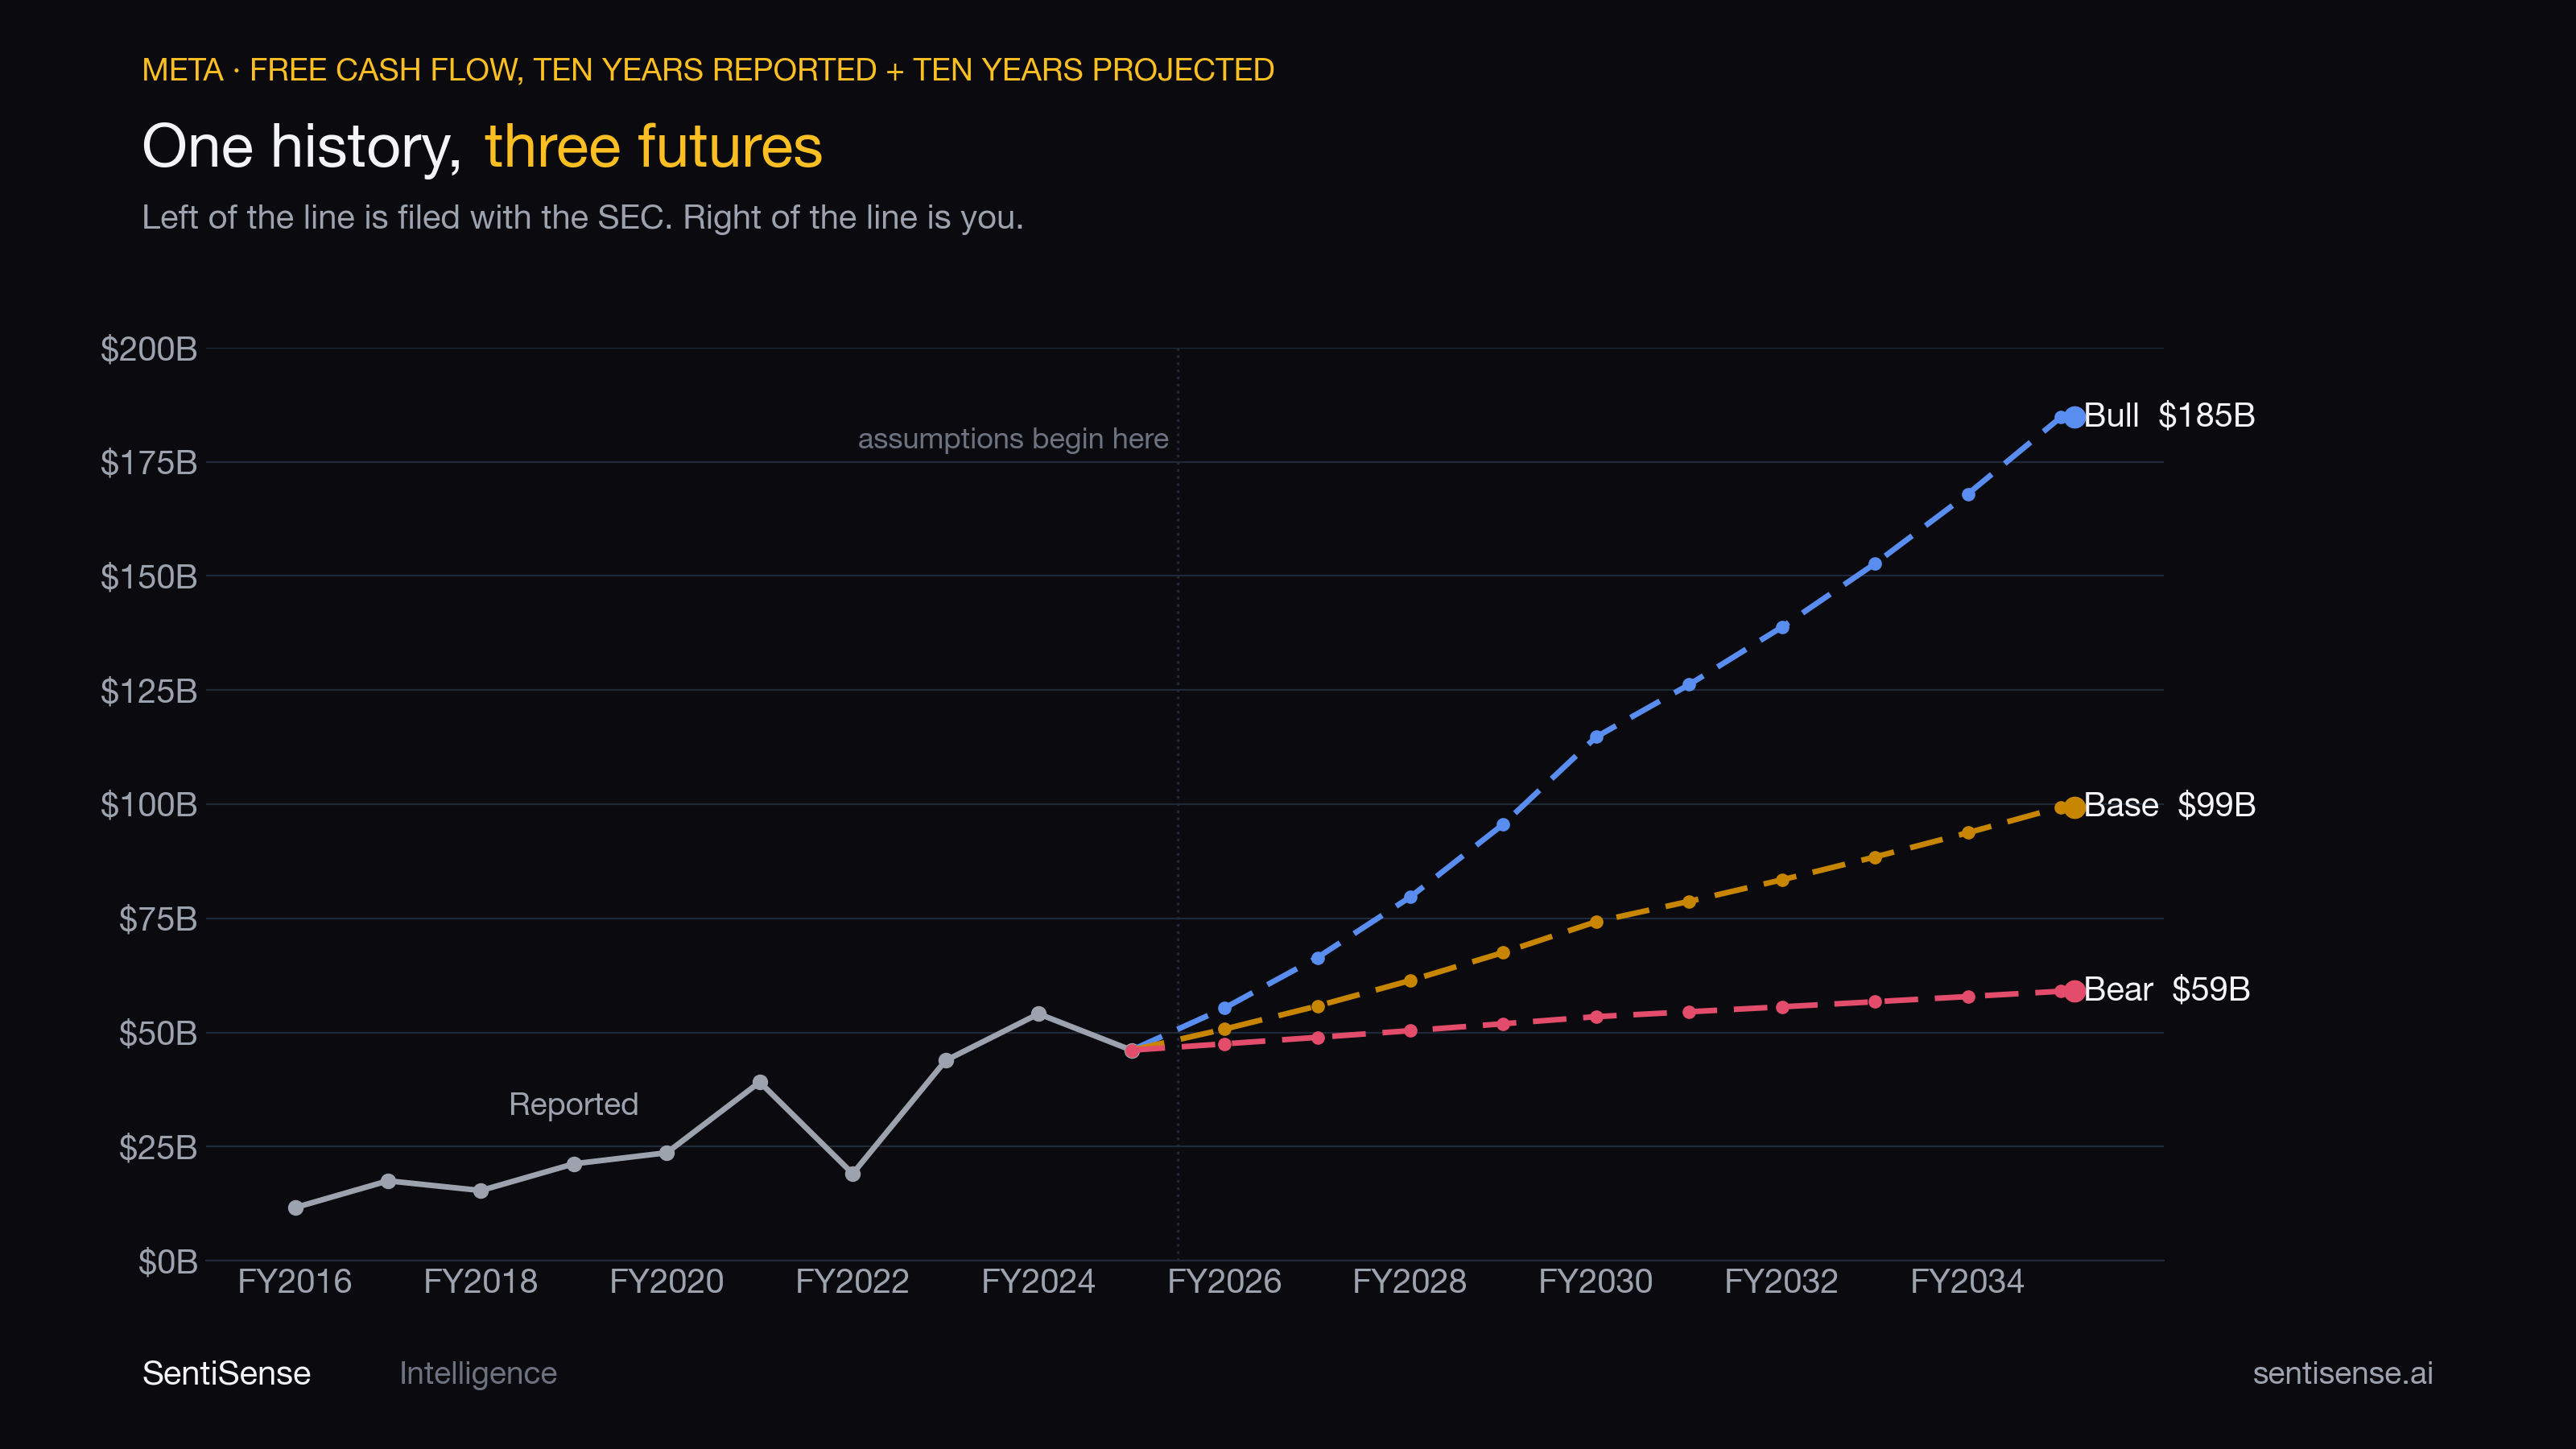
- Bear: FCF grows 3% for years 1 to 5, then 2%. Terminal growth 2%, discount rate 10%.
- Base: 10% for years 1 to 5, then 6%. Terminal growth 2.5%, discount rate 9%.
- Bull: 20% for years 1 to 5, then 10%. Terminal growth 3%, discount rate 8.5%.
For each: projected cash flows, discounted values, terminal value, enterprise value, then bridge to equity value per share. Show your arithmetic. If any input is missing, say so rather than estimating it.
That last line earns its place. It gives the model an explicit exit that is not "make something up," which is the behavior we are trying to design out.
The scenarios are doing real analytical work here. The bear case says the capex is the new normal and growth stalls. The bull case says FY2025 free cash flow is artificially depressed by a buildout that ends, so high growth off that low base is really just normalization plus AI payoff. The base case splits the difference:
Step 4: The bridge, and the numbers to be careful about
To get from enterprise value to equity value you add cash, subtract debt, and divide by the share count. This is where a small sourcing error turns into a large per-share error, so be deliberate. All three figures come from the same tool response:
- Cash on the balance sheet here is cash and equivalents: $35,873M for FY2025. It excludes short-term investments, which for META is a meaningfully larger pool. On this narrow definition META shows net debt (long-term debt is $58,744M); with the securities portfolio counted it does not. If you want the full net-cash figure, source short-term investments separately and say that you did.
- The share count is not returned as a row, so derive it from two fields that are: FY2025 net income ($60,458M) divided by FY2025 diluted EPS ($23.98) gives about 2,521M diluted weighted-average shares. For a company buying back stock, the weighted average runs higher than the point-in-time count, which slightly understates value per share. If precision matters, pull point-in-time shares from the latest filing.
This is the same discipline the whole post is about, applied to ourselves. The tool hands you a labelled number; you still have to know what the label means. An AI will not catch this for you, because the field is populated and plausible, and plausible is exactly the failure mode.
Step 5: Read the spread, not the middle
Computed in Python on the real figures (per-share values rounded):
| Bear | Base | Bull | |
|---|---|---|---|
| FCF growth, years 1 to 5 | 3% | 10% | 20% |
| FCF growth, years 6 to 10 | 2% | 6% | 10% |
| Terminal growth | 2.0% | 2.5% | 3.0% |
| Discount rate | 10% | 9% | 8.5% |
| Equity value per share | $234 | $436 | $881 |
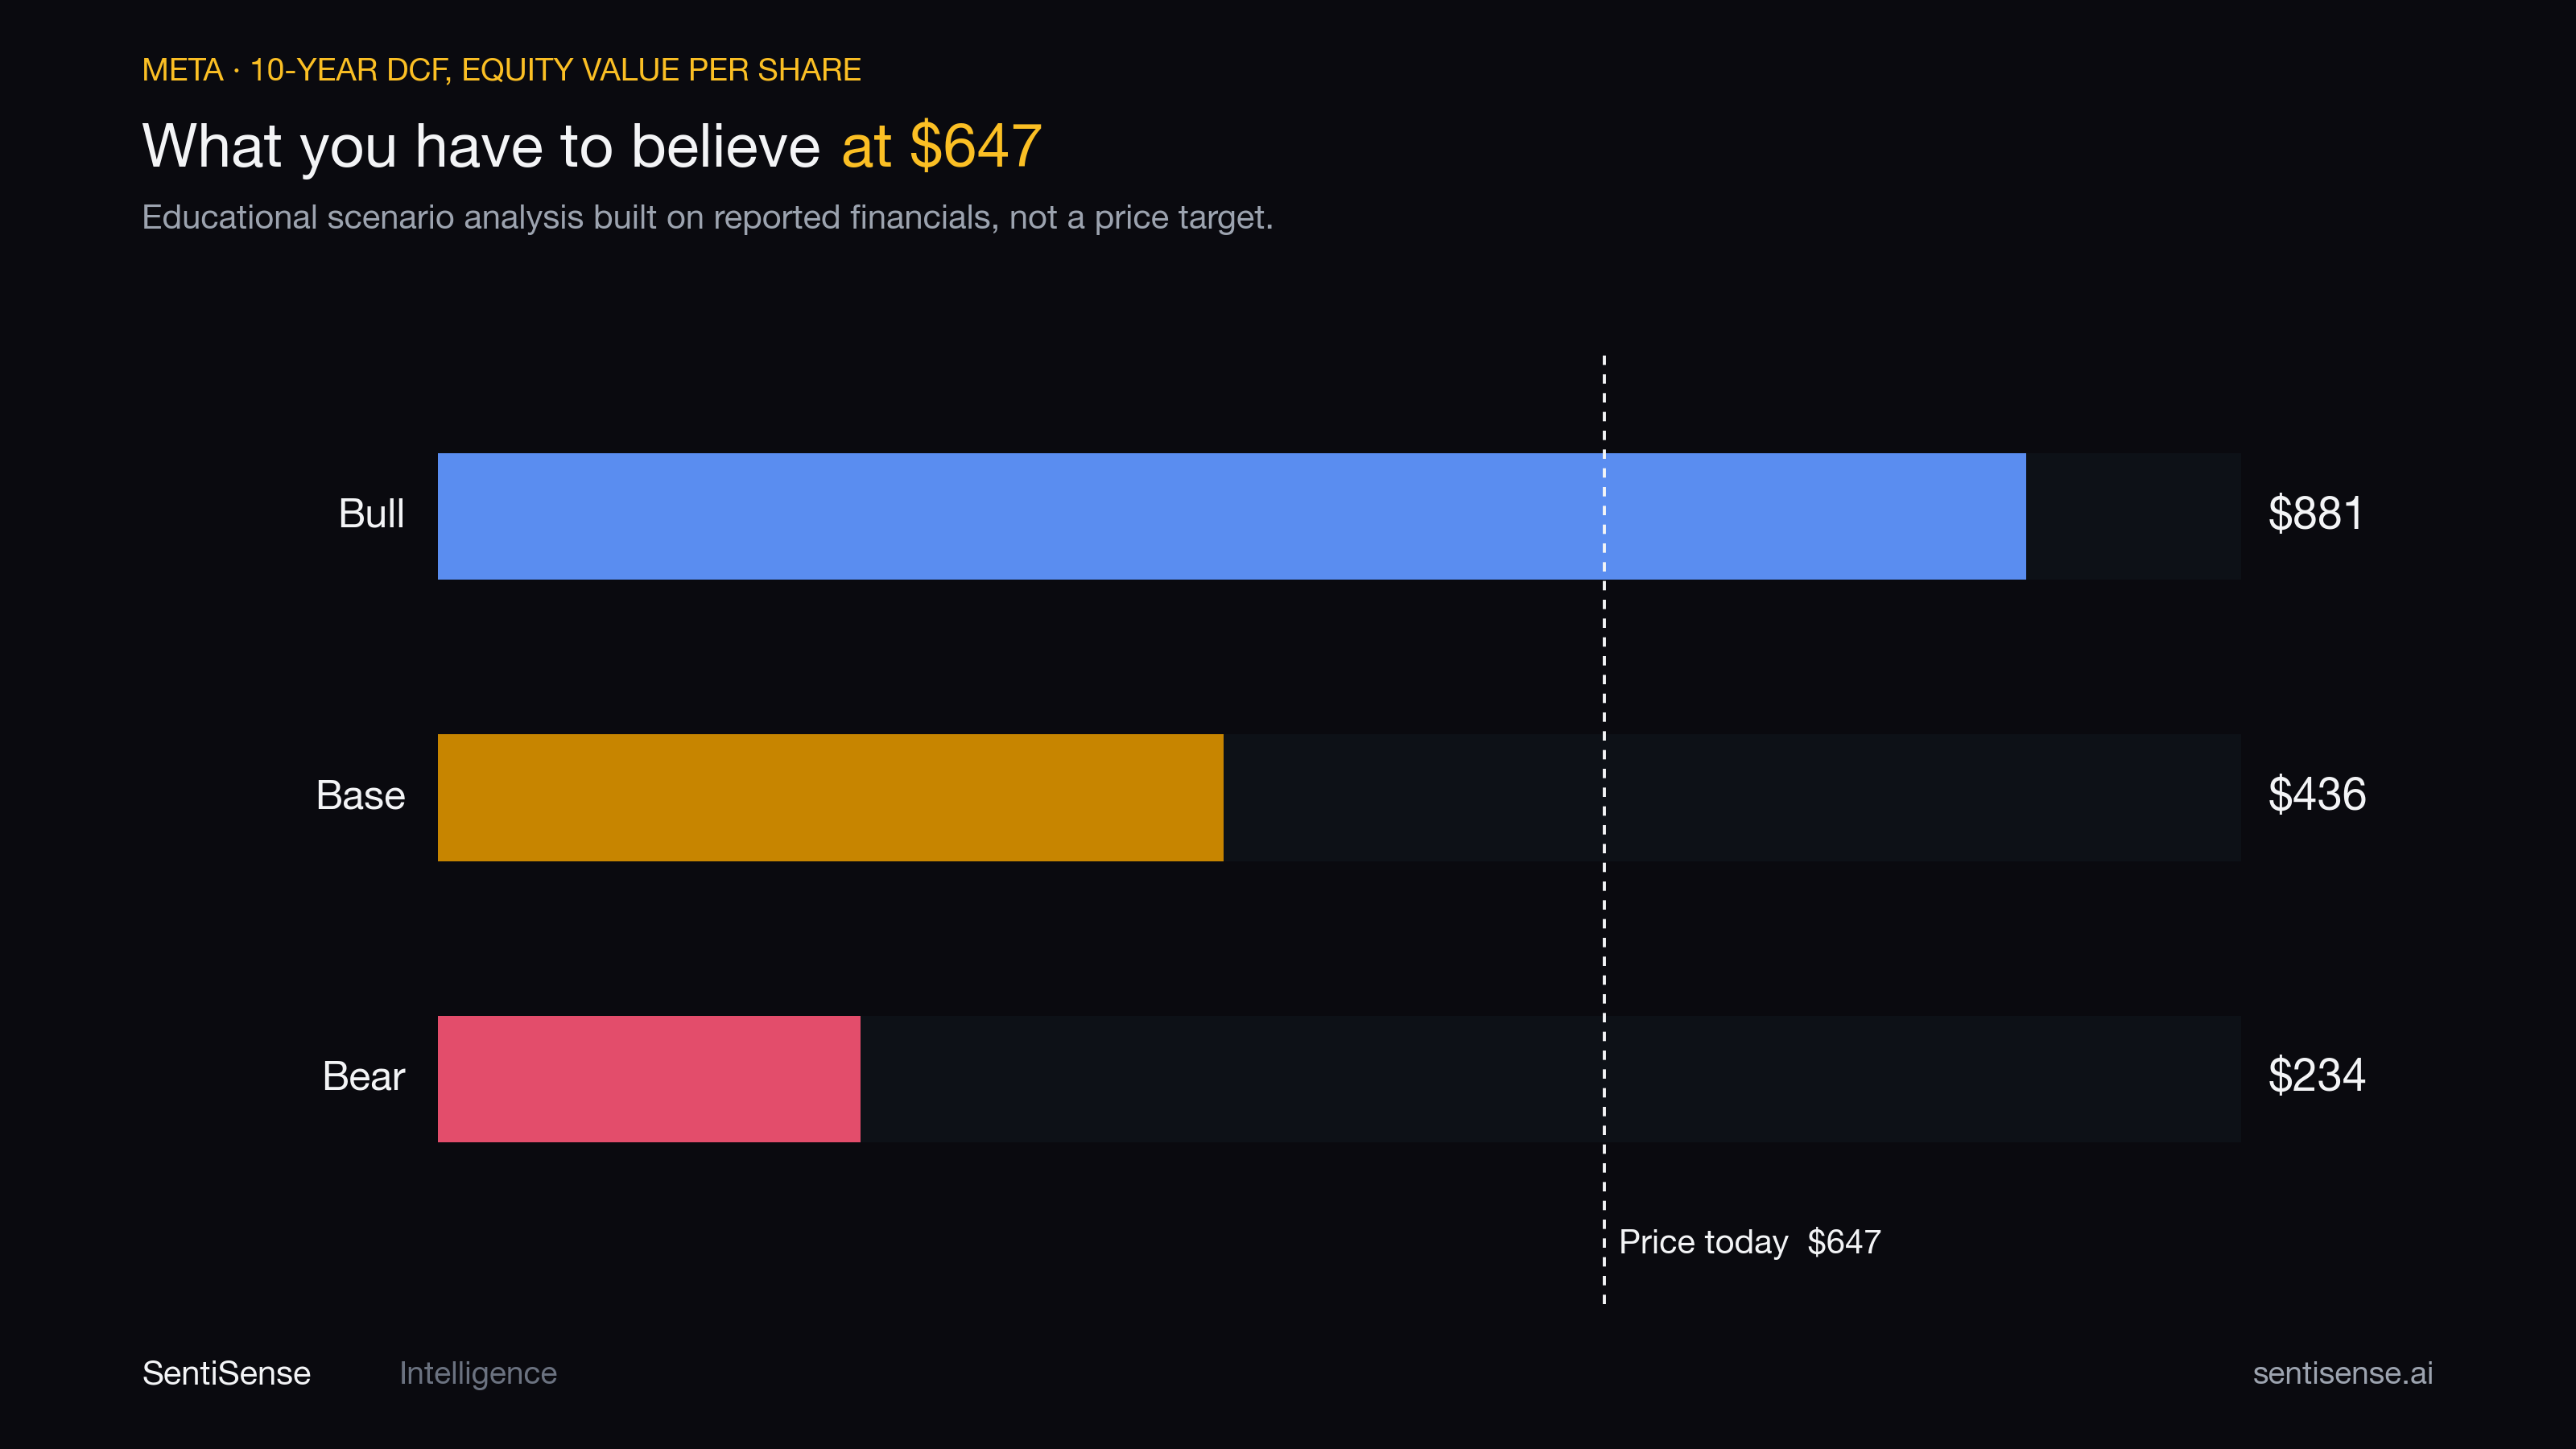
META trades near $647 as this is written. Put the three bars against that line and the model stops being a calculator and starts being a statement: at today's price, the market is pricing in something well past our base case, most of the way to the bull case. To own it here, you have to believe the capex wedge closes and free cash flow normalizes sharply upward. Maybe you do believe that. The point is that now the belief is explicit, sitting on ten years of filed numbers, instead of implicit in a price.
Two more honest reads from the same output:
- The terminal value carries the model. In the base case, 59% of enterprise value sits in the terminal value, which depends entirely on assumptions about year 11 and beyond. That is normal for a DCF, and it is worth sitting with.
- The sensitivity is a sentence away. This is where the chat loop beats a spreadsheet: re-running the grid is one request, not an afternoon. Base growth path, varying only the discount rate and terminal growth:
| Discount rate | 2.0% terminal | 2.5% terminal | 3.0% terminal |
|---|---|---|---|
| 8.0% | $493 | $523 | $558 |
| 8.5% | $451 | $475 | $504 |
| 9.0% | $416 | $436 | $459 |
| 9.5% | $385 | $401 | $421 |
| 10.0% | $358 | $372 | $388 |
If the value swings this much across a plausible range of assumptions, the honest conclusion is that a DCF is an assumption amplifier. Its job is to tell you what you would have to believe to justify a price, not to tell you the price.
What this does not solve
Three honest limits, because a post about AI getting financials wrong should not oversell the fix:
- Circularity is still not solved. A properly integrated three-statement model has interest on debt and cash feeding back into the income statement, which needs iterative calculation. That is a spreadsheet feature, not a reasoning feature, and language models do not do it well. If you need a fully circular model, build it in a spreadsheet and use this to source and sanity-check the inputs.
- Reported is not adjusted. Everything here is as-filed. Normalizing for one-off items, changes in accounting treatment, or segment reclassification is analyst work, and it is still yours.
- Coverage is deepest on the most-watched US names. For an obscure micro-cap or a foreign filer, expect gaps. When a period is missing, the tool says so rather than filling it in, which is the behavior you want even though it is the less impressive demo.
The actual point
The interesting thing here is not that Claude can do DCF arithmetic. It always could. The interesting thing is which half of the job you hand it.
Give a model the reasoning and keep the facts sourced, and you get a fast, auditable, genuinely useful research loop. Give it both and you get a confident answer built on remembered numbers, which is the one thing a valuation cannot survive.
The math was never the hard part.
Educational content only. Nothing here is investment advice, a price target, or a recommendation to buy or sell any security. The scenarios are illustrative assumptions, and different assumptions produce different answers. Figures as reported by the company for fiscal years 2016 to 2025; price as of writing. Do your own research.
Try it: add the SentiSense connector
to Claude or ChatGPT and ask for ten years of any covered company's financials. No code required,
free to try. Building a product or an agent? The same data is one REST call away:
GET /api/v1/stocks/fundamentals/history. Get a free API key.