
The SentiSense Rating, in Beta: One Letter Grade Built From Seven Public Signals, With the Arithmetic Showing
Every covered stock now carries a daily SentiSense Rating, a letter from A to F built from a score you can check by hand: a rank across seven families of public signals, minus a published points table of risk conditions. It ships in Beta: the numbers are live for everyone, the response shape is stable, and the method will keep being tuned in the open, with every change versioned.

A stock page has always had a problem of arithmetic. There are too many numbers on it, they come from sources that do not know each other, and each one is honest about one thing only. Analysts publish targets. Insiders file Form 4s. Funds file 13Fs a quarter late. Options traders position. The crowd talks. The financial statements arrive every ninety days. A reader who wants to know where a stock stands, today, across all of that, has to keep seven tabs open in their head and do the blending themselves.
The SentiSense Rating does the blending, and then it shows its work.
What the Rating is
Every trading day, once the prior session's options and price data have settled, SentiSense rates every covered stock that has enough data. Each stock gets a score from 0 to 100, carried to one decimal, and a letter that is a band of that score: A at 90 and above, B from 70, C from 30, D from 10, F below 10.
The score has exactly two constituents, and both are published beside it.
The first is a rank. Seven families of public signals are each turned into a percentile among the stocks rated that day, then blended with fixed weights into one composite, and that composite is ranked again across the whole rated set. A stock at the 87th percentile has blended signals stronger than 87 percent of the market that morning.
The second is a points table. Twelve risk conditions can each take up to 12 points off the rank: a company that is not profitable, one with no filed financials, a listing under a year old, five or more insiders selling in a quarter, a weak reading on any one family, thin coverage, high leverage, a small market cap, thin trading, a price stretched far above its own average, institutions cutting a position while the price rises, and a trailing earnings multiple in the rich tail of the market. Most of these are graded, so a company just under a threshold pays a little and one far past it pays the full 12.
Score equals rank minus the sum of those points. The letter is the band of the score. The composition card on every stock page spells the line out: rank, adjustments, score, then each condition and what it cost. If you can subtract, you can audit any grade on the site.
The seven families
Each family answers a different question, and each one is ranked across all rated stocks before it is blended, so no family can dominate the others by having a larger scale.
Crowd sentiment. What people are saying about the stock across news and social media over the trailing week, measured by the SentiSense Score, with a smaller weight on how much of the day's conversation the stock takes up. A stock needs at least 20 mentions in the week to have this reading at all.
Smart money. Whether professional and insider money has been flowing in or out: the net change in institutional shares in the latest 13F quarter, the balance of insider purchases and sales over the trailing 90 days with scheduled 10b5-1 sales left out, and the balance of disclosed congressional trades over 180 days. Three readings, ranked, blended, and shown individually on the card.
Options positioning. How options traders are positioned, from put and call volume, skew and net delta, read against the stock's own recent history. Present only where a liquid options market exists.
Analysts. The share of covering firms with a positive rating and the implied upside to the mean price target, for stocks with at least three analysts and a consensus refreshed within two weeks.
Fundamentals. Business quality from the filed statements: trailing twelve month operating margin, return on equity and revenue growth, plus durability, the share of the last twenty quarters with positive operating income, positive free cash flow and revenue above the year before. Each is ranked and the ranks are averaged, so a company that has been doing this for a decade separates from one that started last year. Valuation and leverage are deliberately not in this family. A cheap stock is not a strong stock, so price paid is handled as a risk adjustment instead, and leverage would rank every bank unfairly without a sector adjustment.
Earnings. How the most recent quarter landed against expectations and how the market took it, for reports within the trailing 120 days.
Technicals. Where the price sits versus its own history: above or below its 200-day and 50-day averages, its twelve-month path, and how calm or violent its recent sessions have been, with calmer ranking higher. This is a description of the trend the stock is in, not a claim about where it goes next. It is in the Rating because a reader who opens a chart sees the trend immediately, and a grade that ignored it would be arguing with the picture.
The weights are 20 percent for fundamentals, 16 percent each for crowd sentiment, smart money and technicals, 12 percent each for options positioning and analysts, and 8 percent for earnings. They are engineering priors, published so they can be argued with, and the methodology page records every change to them with a version.
What Beta means here
The Rating is launching in Beta, and we want to be precise about what that word covers, because it is often used to cover everything.
It does not cover the plumbing. The endpoint, the fields, the letter bands and the arithmetic are stable. A client that reads score, letter, percentile and riskAdjustments today will read the same fields in a year, and every response carries a betaNotice string that says so in plain words until the label comes off.
It does cover the method. We have run the Rating for two weeks under an internal gate, and those two weeks already changed it three times: a technicals family was added, the weights moved toward fundamentals, and the version that writes today's grades adds durability to fundamentals and a valuation adjustment for a very rich earnings multiple, each measured against the full universe in a paired dry run before it wrote a single grade. The next change is already on the list: fundamentals are ranked across the whole market rather than within sectors, which is unkind to banks and generous to software. Each change of that kind gets a new methodologyVersion, is dry-run on the live cross section first, and is described on the methodology page before it ships. Grades written under an older version keep that version on the row, so history never quietly changes meaning.
Beta is a promise to keep tuning in public, not a warning that the numbers are provisional. The subtraction on the card is exact today. What may change is what goes into it, and you will be able to see when it does.
Why a percentile, and not a number that means something on its own
A Rating is relative on purpose. An A says the stock ranks near the top of the market that morning across these signals and carries few risk conditions. In a strong tape that is a high bar; in a weak one it is the top of a weak field, and the methodology page says so.
The alternative, a fixed scale where 80 always means the same thing, would need us to know what "good" is in absolute terms across a thousand companies in forty industries. We do not, and neither does anyone selling you one. A percentile makes a smaller, checkable claim: on these inputs, on this day, this stock is ahead of that share of the others. When the inputs change the rank moves, and the daily history on the card shows the move.
What the Rating is not
The SentiSense Rating is not a recommendation to trade, a forecast of returns, or a statement about whether a stock is suitable for anyone. An A does not say the stock will rise. An F does not say it will fall. The weights have not been validated against forward returns, and we have said so in writing on the methodology page; a ledger that tracks each Rating against what happened next is planned, and its results will be published there whether or not they flatter us.
It is also not the SentiSense Score. The Score is the continuous crowd-sentiment number and is one of the seven inputs. The Rating is the composite grade. Those are the only two headline measures SentiSense publishes, and we intend to keep it that way.
Every family has known blind spots, listed on the methodology page: fundamentals are ranked across the whole market rather than within sectors, institutional data lags by a quarter, options readings exist only where options trade, analyst coverage is thin for small companies, the crowd can be moved by a few loud accounts, and a trend reading describes the past year of prices and nothing else.
Where to find it
On every stock page, the composition card sits under the header: letter, score, rank, adjustments, the seven family rows with their percentiles and raw readings, the anomaly flags, and a strip of the last month of daily ratings. The stocks table and the screener carry the letter and score as a sortable column and a filter.
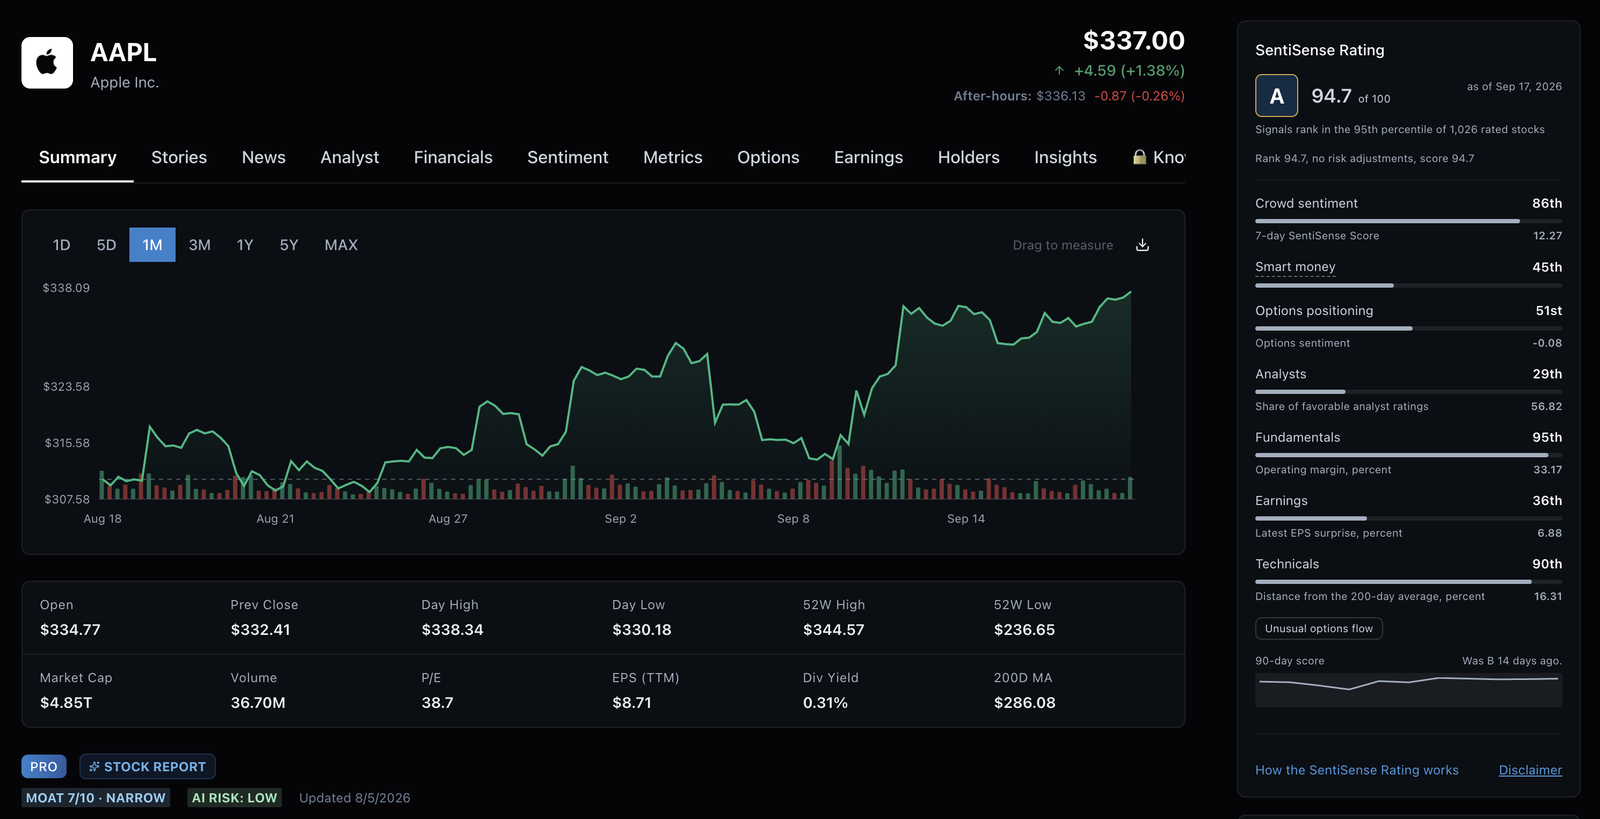
For agents and builders, the same numbers come back from one call to the SentiSense Rating API, with the rank, every adjustment and the score side by side so a client can check the subtraction itself. The Python and Node SDKs, the MCP connector and the published skills carry the same fields, on the free plan, with an API key.
The full method, the weights, the floors, the points table and the version history are on the methodology page. Read it before you read a grade. A grade you cannot check is an opinion; this one is a subtraction.