Introducing Options Intelligence: Percentile-First Options Data for Everyone
Most retail options data is either a raw chain you have to decode yourself or a paid flow terminal that costs more than a car payment. Today we are launching Options Intelligence: an options radar and a per-stock options tab that rank every reading against the stock's own history, free with a SentiSense account, plus a public API, an MCP tool, and an agent skill for builders. 'High IV' finally means something, because we tell you high relative to what.

If you have ever opened an options chain to answer a simple question, you know the problem. You wanted to know whether a stock's options look unusual right now. What you got was a grid of hundreds of strikes and expirations, a wall of implied volatility numbers, and no way to tell whether any of it is high, low, or perfectly ordinary for that name.
The two ways retail usually solves this are both bad. Either you stare at the raw chain and try to hold a year of context in your head, or you pay for a flow terminal that costs more per month than most people spend on groceries. There has not been a clean middle: proprietary options context, priced for a normal person, that tells you what is actually unusual.
Today we are shipping that middle. Options Intelligence is an options radar plus a per-stock options tab, free with a SentiSense account, and it is built on one idea: every reading is ranked against the stock's own history, never a market-wide average. A raw "put/call ratio of 2.9" is noise. "Put/call volume in the 99th percentile of this stock's own trailing year" is a signal.
The radar
The Options Radar is a market-wide leaderboard of which stocks' options look most interesting today, out of roughly 950 of the most-watched US names. Every cell shows a value and, next to it, a small gold tick marking where today sits inside that stock's own one-year range.
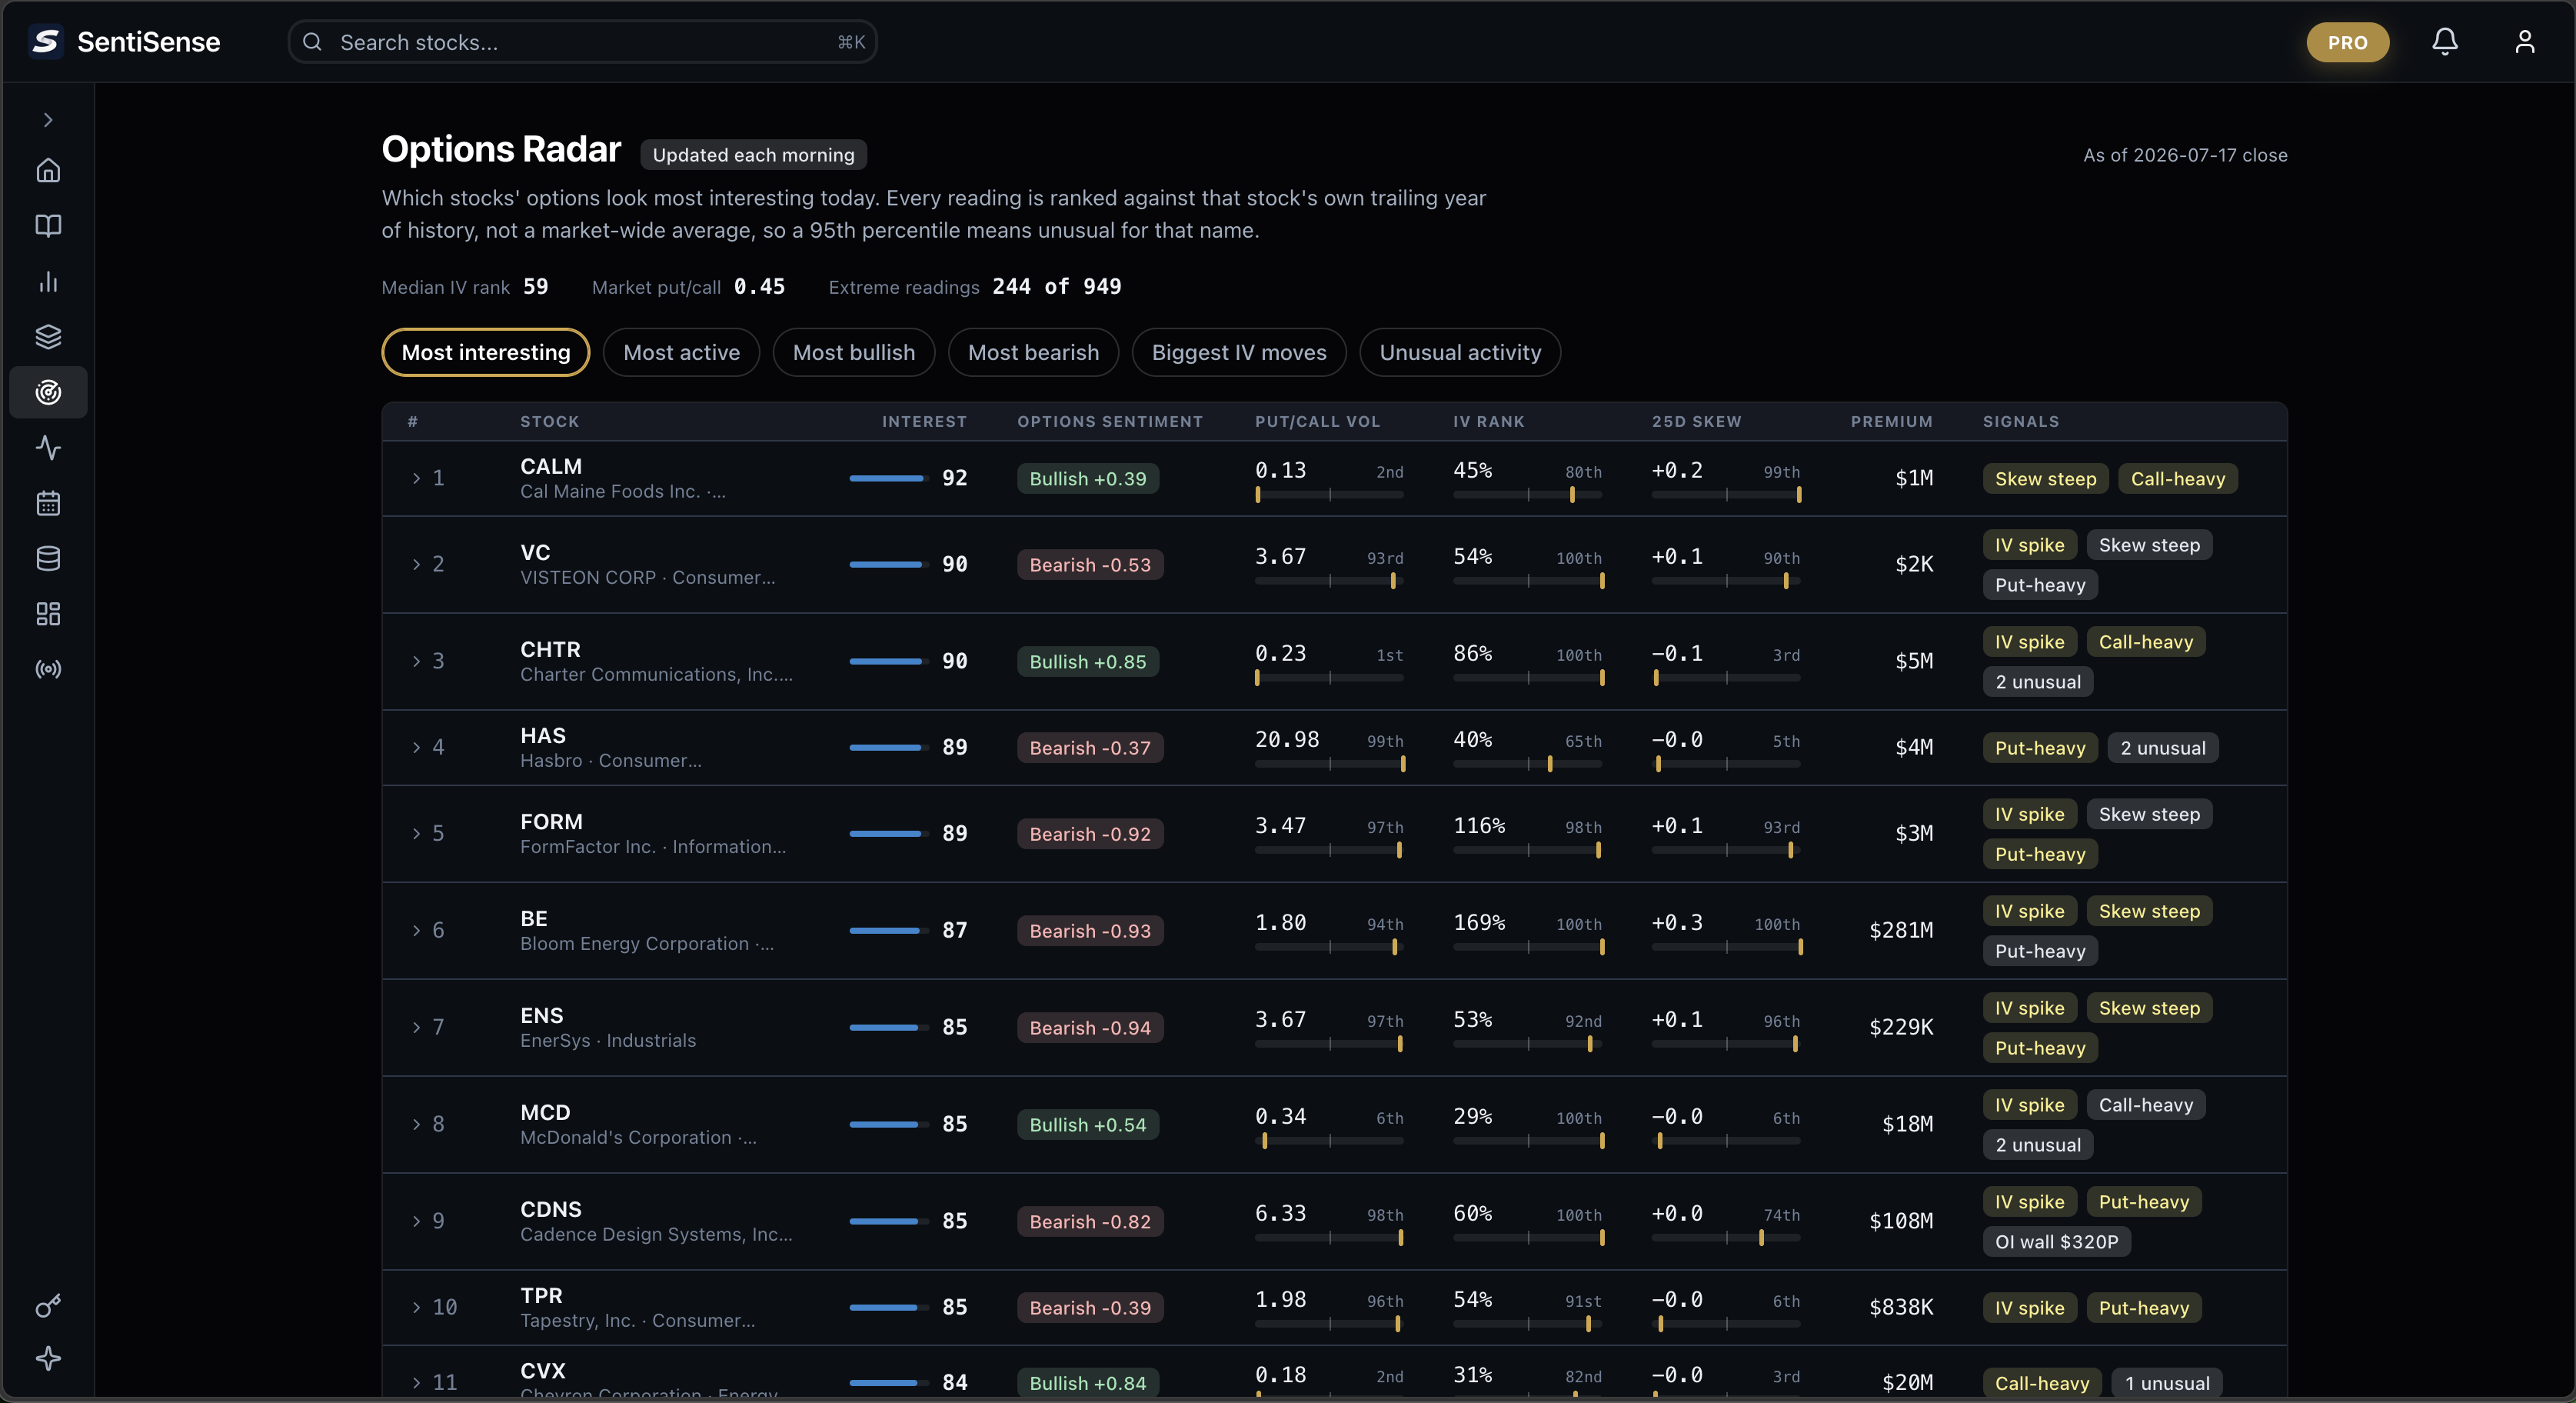
As of the July 17 close, the top of the board was Cal-Maine Foods (CALM), the egg producer, at 92.2, with Visteon (VC) at 90.3 and Charter Communications (CHTR) at 89.9 just behind. Here is what CALM's row actually said that day, in plain terms:
- Options were unusually expensive. Implied volatility is the market's estimate of how much a stock might move; when traders expect bigger swings, options cost more. CALM's implied volatility was higher than on roughly 80% of days in its past year (an IV rank of 80). The options market was bracing for a bigger-than-normal move.
- The day's trading was almost all call-side. A put is a contract that profits if the stock falls; a call profits if it rises. CALM's put/call volume sat at the 2nd percentile of its own year, meaning the day's trading was about as call-heavy as this stock ever gets.
- And yet downside insurance was pricey too. Skew compares what traders pay for downside protection versus upside bets. CALM's skew sat at the 99th percentile of its own year: crash protection on this name was priced about as richly as it has been at any point in twelve months.
One stock, one day, three readings, each meaningful only because it is measured against CALM's own normal. None of that is readable off a raw chain. Across the whole board that day, the median stock's IV rank was 59, market-wide put/call volume ran 0.45, and 244 of 949 covered names showed at least one extreme reading.
That is the whole point. You are not reading one stock's number against another stock's number. You are reading each stock against itself, so a 95th percentile actually means unusual for that name.
These are observations about how each stock's options are priced and traded relative to their own history. They are educational, not investment advice. Nothing here is a prediction or a recommendation, and none of it says where a stock is headed.
The per-stock tab
Every stock page now carries an Options tab. Its centerpiece is the options-implied range: a fan drawn from today's option prices showing where the options market itself thinks the stock could trade over the next 90 days. The darker band is the zone the market gives roughly 2-in-3 odds; the wider band is the 95% zone. It is not a forecast and not a price target. It is simply what current option prices imply, drawn honestly.
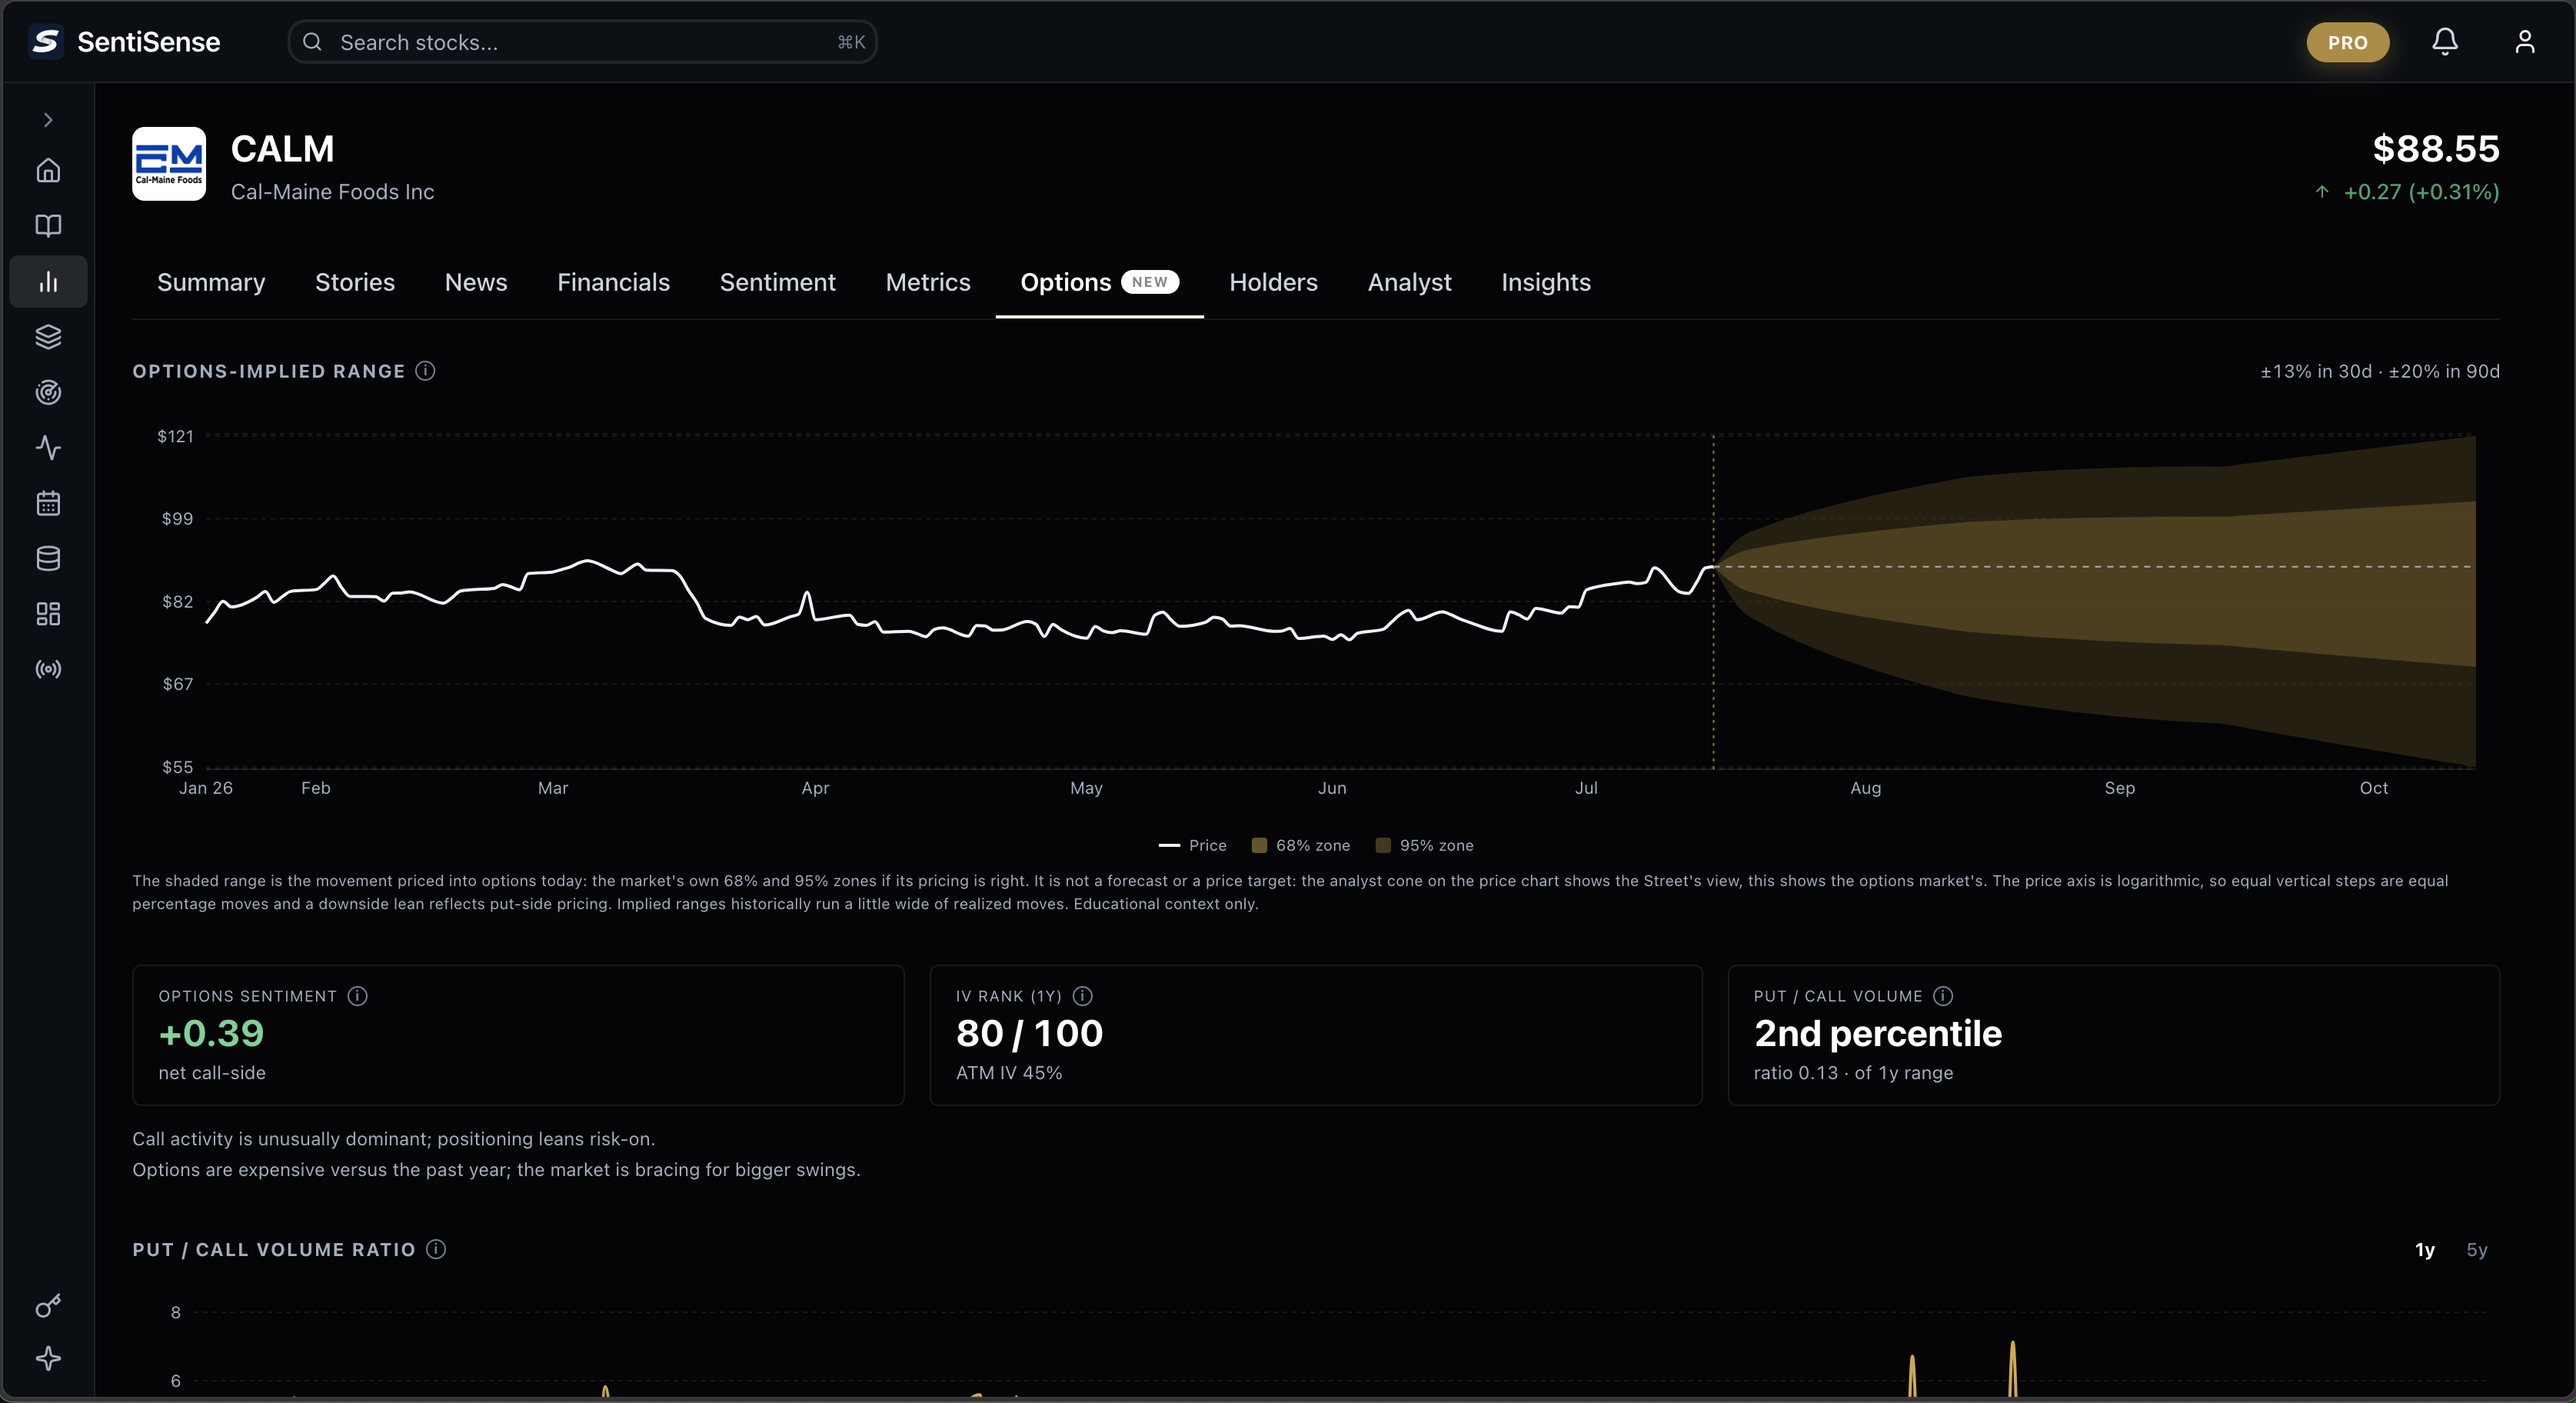
For CALM that meant a priced-in move of about ±13% over the next 30 days. A big, quiet mega cap might read ±4% on the same chart. One picture answers "how big a move is the market braced for" faster than any chain ever will.
Below the fan, the tab reads out the day's positioning with the same percentile spine, one name at a time:
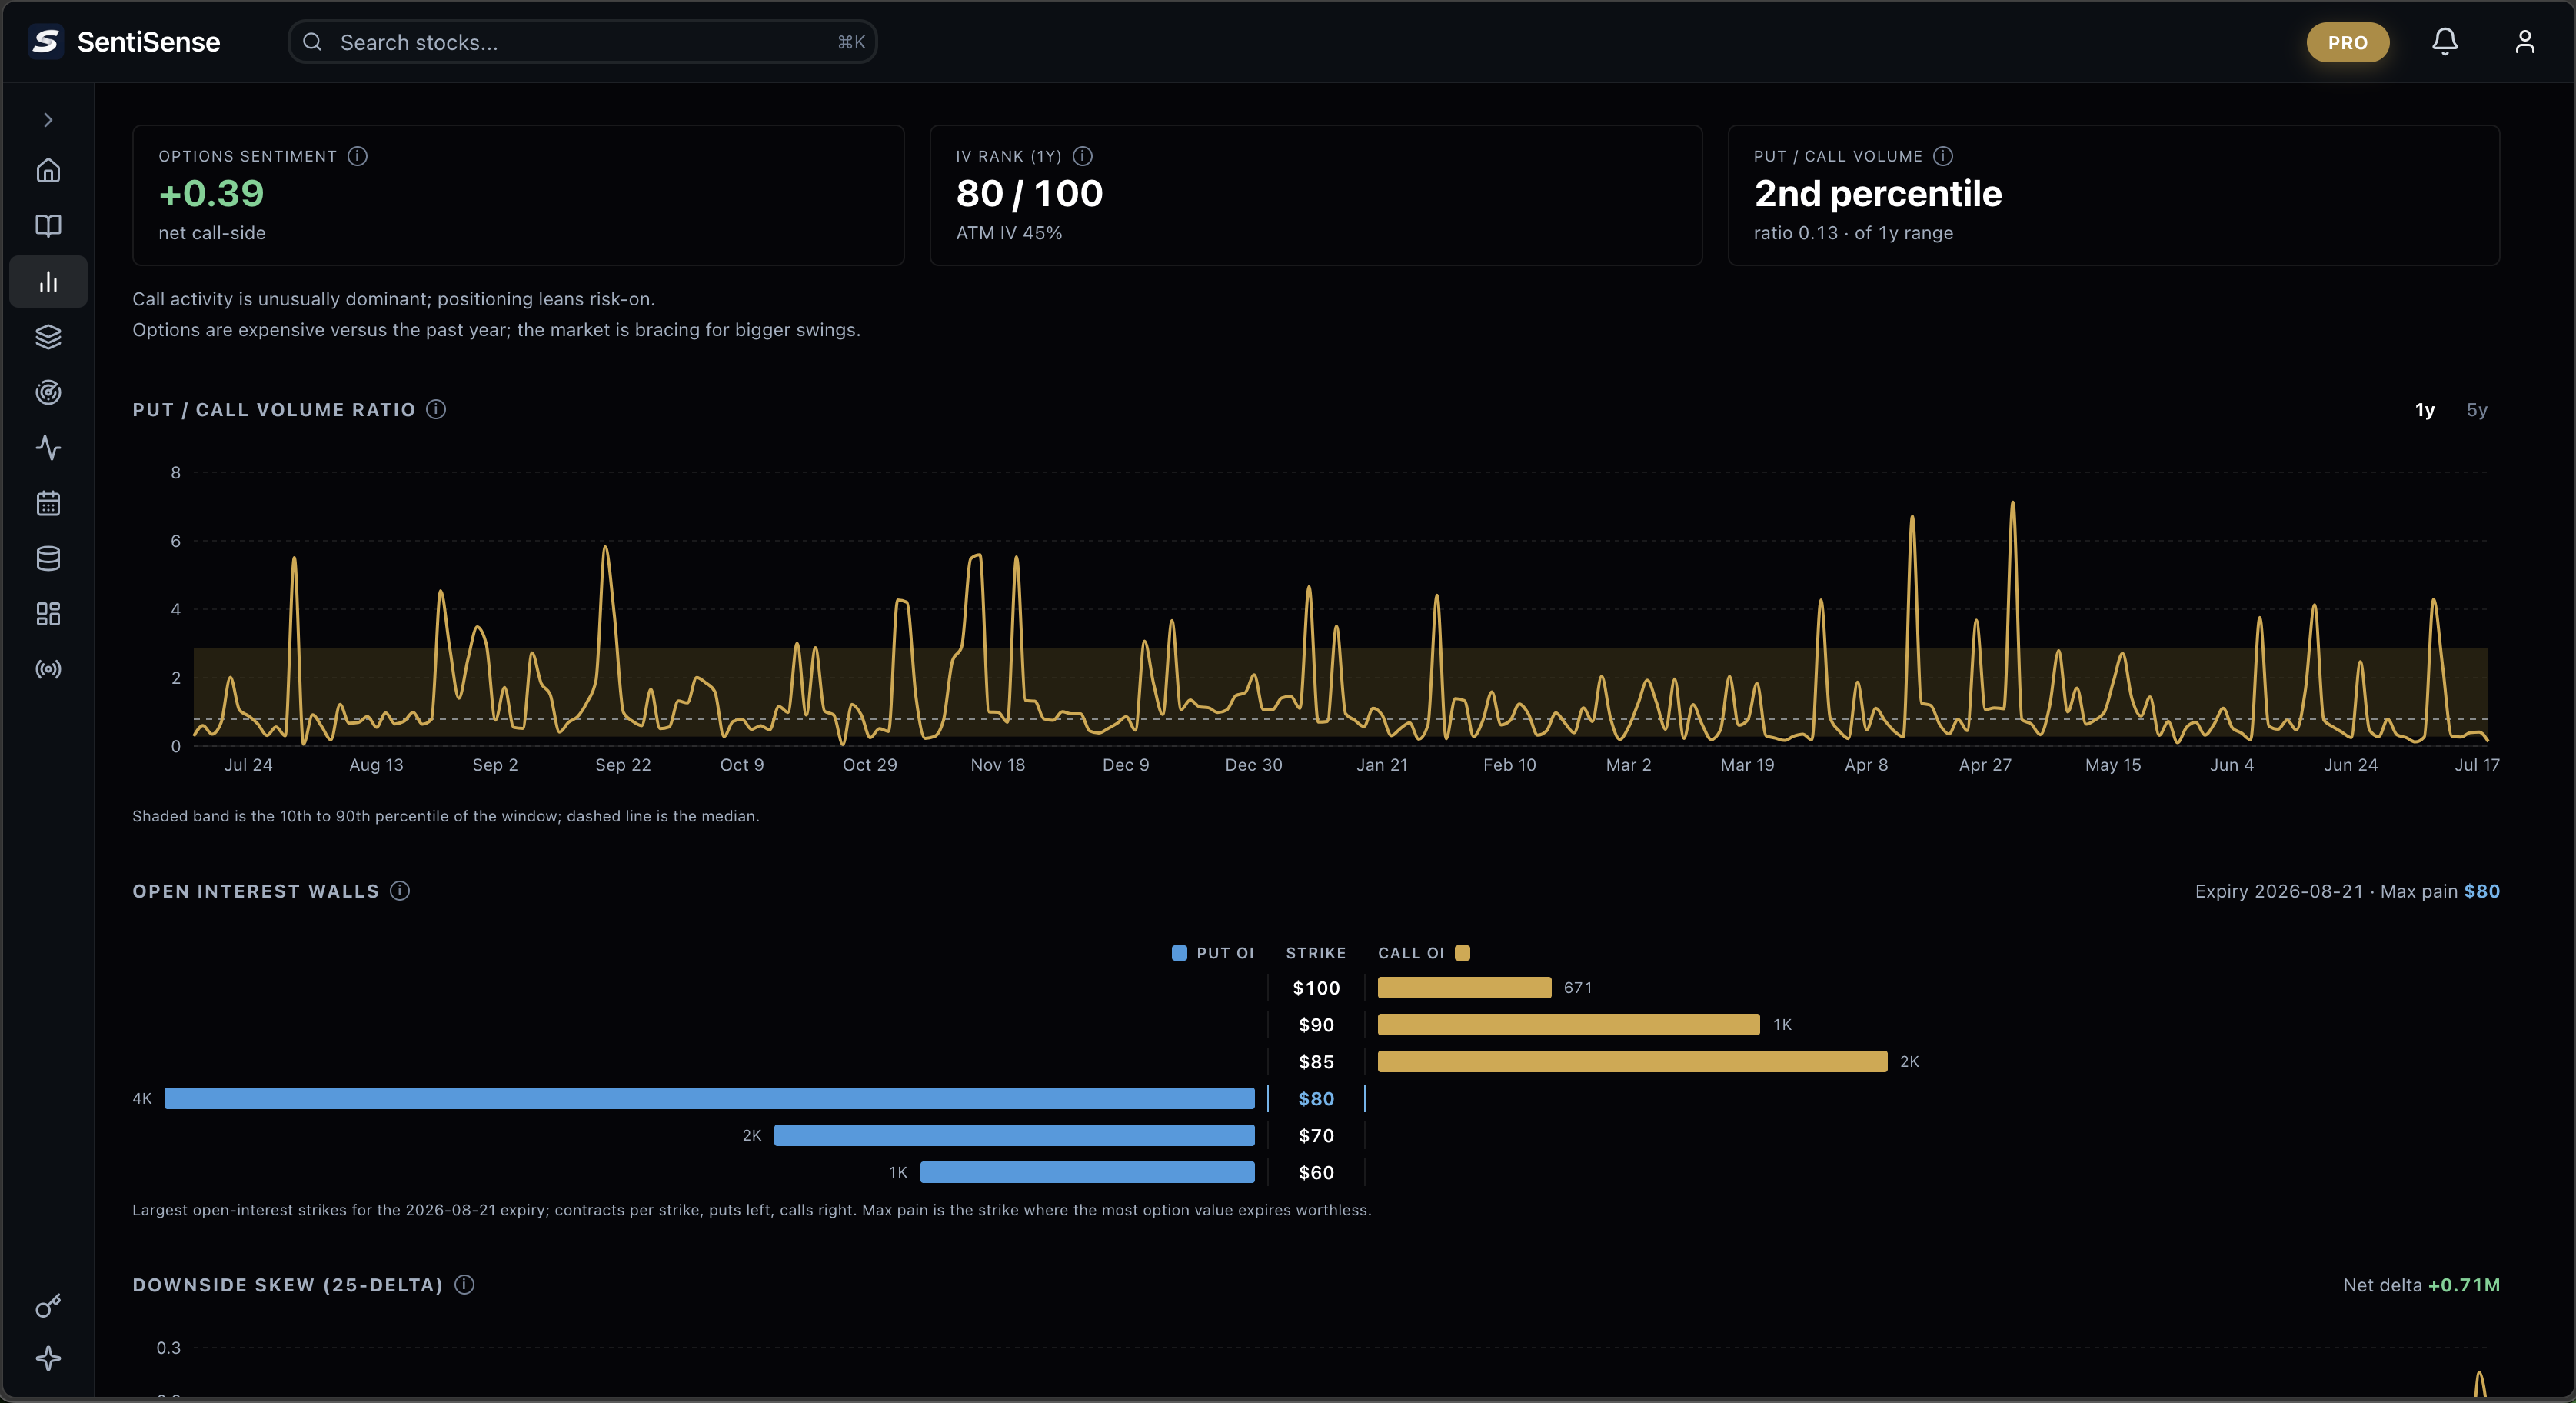
Two of these stop being jargon the moment you see them drawn:
- Open-interest walls are the strikes where the most contracts are parked. For CALM's August 21 expiration, the biggest pile of calls sat at the $85 strike (about 2,000 contracts) and the biggest pile of puts at $80 (about 4,300). Those are the price levels the options crowd has committed the most money around.
- Max pain is the price at which the largest amount of option value would expire worthless, $80 in CALM's case. It is a reference level traders watch into expiration week, nothing more.
Those are the levels the options market itself has built, drawn for you instead of buried in a chain.
How it is built, honestly
A few things worth saying plainly, because the honest version is the trustworthy version:
- This is end-of-day data, not a real-time tape. We read each session's settled option chain and refresh the radar every morning, Tuesday through Saturday, usually by 8am ET. If you need live intraday prints, this is not that, and we will not pretend it is.
- Baselines take time to mean anything. We keep two years of end-of-day options history per name and score today against the stock's own trailing year. A name needs about 60 trading sessions of history before its percentiles are trustworthy. Until then we show "building baseline" instead of inventing a number.
- We only claim what the data can support. Open interest and volume tell you how much is trading, not whether it was bought or sold. Our dealer-gamma reading is a labeled approximation, because you cannot see signed dealer inventory from public open interest. We say so, in the tooltips, on the page.
Free and PRO, stated plainly
In the web app, it is simple: sign in and every plan sees the full Options Radar and the full per-stock Options tab. A free account is all it takes.
The API works like the rest of the SentiSense API: every endpoint takes an API key, and a free key is a two-minute signup. Free keys read the top 25 rows of the ranked radar, 10 full per-stock options dossiers per month, and one year of history. PRO at $15 per month removes the caps: the full board, unlimited dossiers, and full history.
For builders
The same data is available through the API and as an agent tool, so you can wire it into your own research instead of screenshotting ours.
curl -s https://app.sentisense.ai/api/v1/options/overview \
  -H "X-SentiSense-API-Key: $SENTISENSE_API_KEY"
That returns the radar snapshot: one row per covered stock, each with its own-history percentiles for IV rank, put/call, and skew, plus the interest score, an options sentiment reading, and notional volume. There is a per-ticker companion at /api/v1/stocks/{ticker}/options/summary for the IV term structure, the walls, max pain, and the day's unusual contracts; it also works for the ETFs we track (SPY, QQQ, GLD, the sector funds), which carry the same readings but never appear on the radar board. The full reference lives in the options API docs.
For AI agents, the same data is exposed two ways. The get_options tool ships in the SentiSense MCP connector for Claude and ChatGPT, and there is a dedicated agent skill, unusual-options-activity, published for coding agents:
npx skills add SentiSenseApp/skills -s unusual-options-activity
Either way, an agent can ask "which stocks' options look most unusual today, ranked against their own history" and get cited, structured numbers back.
Try it
The Options Radar is live in the app today, and a free account is all you need to see the full board.
SentiSense provides market information and options analytics for informational and educational purposes only. Options readings are derived from end-of-day option chain data and ranked against each stock's own history. This product is not investment advice, is not a recommendation to buy or sell any security or options contract, and past readings are not indicative of future results. Options trading carries significant risk. Always consult a licensed financial advisor before making investment decisions.