Position Size Calculator: Risk Per Trade
Use a position size calculator to estimate how many shares fit your risk per trade and stop loss distance, with ATR context and delayed market data.

A position size calculator converts an account-level risk budget and a stop loss distance into a whole-share count. The formula is:
Position size in shares = floor((account size x risk per trade percentage) / abs(entry price - stop price))
The calculation answers how many shares fit the inputs a reader supplies. It does not decide whether to trade, what risk percentage to use, where to enter, or where to place a stop.
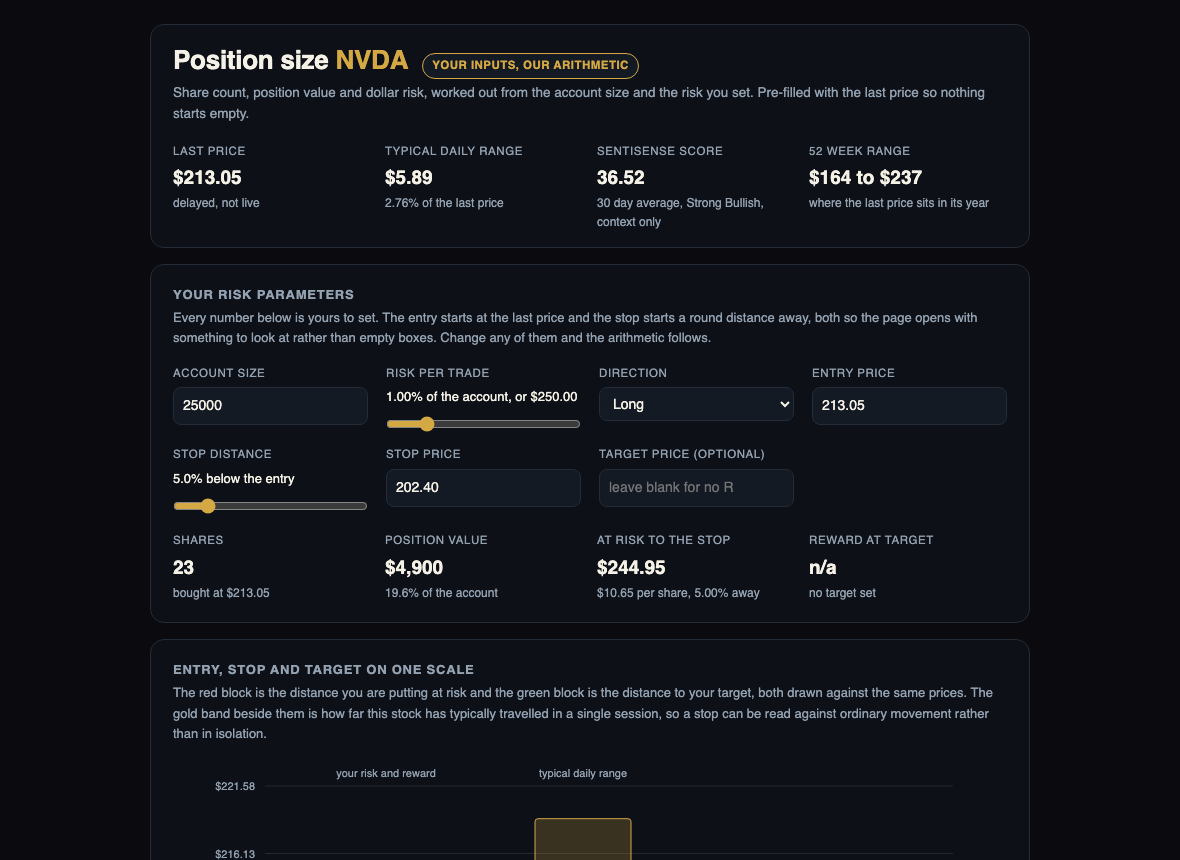
Most position size calculators open as five empty boxes waiting for numbers you have to go find somewhere else. The SentiSense position-size-calculator skill opens full: it pre-fills a delayed regular-session price, a 14-session average true range, and contextual SentiSense Score data, then creates a self-contained HTML calculator that works offline. Change the account size, risk per trade, entry, stop, or optional target, and the arithmetic updates inside the saved file. It is one of SentiSense's agent skills for market data.
How a position size calculator works
The risk budget is the account size multiplied by the selected risk-per-trade percentage. The stop loss distance is the absolute difference between entry and stop. Dividing the budget by that per-share distance gives the share count, which is floored to a whole number so the planned loss does not exceed the stated budget before gaps, slippage, and costs.
Position size formula
Risk budget = account size x risk per trade percentage
Stop loss distance = abs(entry price - stop price)
Whole shares = floor(risk budget / stop loss distance)
How many shares to buy: a worked example
The phrase "how many shares to buy" describes a sizing calculation here, not a recommendation. With a $25,000 account, a user-selected 1% risk level creates a $250 risk budget. An entry of $213.05 and a stop of $202.40 create a $10.65 stop loss distance. The calculation is floor($250 / $10.65), or 23 shares. The planned loss at the stop is $244.95 before gaps, slippage, and costs, and the artifact reports the $5.05 of unused budget that flooring leaves behind rather than hiding it.
| Term | Meaning in this calculator |
|---|---|
| Risk per trade | The dollar or percentage budget selected as planned loss at the stop |
| Stop loss distance | The absolute difference between entry price and stop price |
| Position size | The whole-share count after dividing the risk budget by stop loss distance and flooring the result |
| ATR | Historical average true range, shown as context and not used to choose the stop |
| R multiple | Favorable target distance divided by stop loss distance |
Risk per trade and the 1% rule
Risk per trade is the amount of account value a reader chooses to use as the planned loss at the stop. The 1% rule is a commonly named position-sizing convention in which that budget equals 1% of the account. It is not a recommendation or a guarantee. The calculator accepts the percentage the reader selects and reports the arithmetic that follows. When the inputs make no sense, it refuses: a long position whose stop sits at or above the entry has no risk distance to divide by, so the page says exactly that and shows no share count at all.
Stop loss distance and ATR
Stop loss distance is the absolute difference between entry and stop. A smaller distance produces more shares for the same risk budget, while a larger distance produces fewer. Average true range, or ATR, summarizes recent session movement, including overnight gaps. Comparing stop loss distance with ATR adds historical context, but ATR does not decide where a stop belongs and does not predict the next move.
In the artifact generated for this article, NVDA's 14-session average true range was $5.89 as of August 24, 2026. A 5% stop from the $213.05 example entry was $10.65 away, or about 1.81 times that historical range. A 2% distance was $4.26, which was inside one average session's range. These comparisons describe the dated inputs and do not predict future movement or determine where a stop belongs. That comparison is the one thing here a spreadsheet does not already do, and it is the sentence most calculators never show you.
The delayed prefill comes from the Stocks API or ETFs API, depending on the instrument. The SentiSense methodology explains how the contextual Score is built; the Score does not affect the position-size calculation.
R multiple and an optional target
R multiple compares the favorable distance from entry to target with the distance from entry to stop. A target twice as far from entry as the stop is 2R before costs. The calculator reports R only when the target is on the favorable side of the entry. It does not assess whether the target is likely or whether the trade is worthwhile.
Limits of risk-based position sizing
Risk-based sizing assumes a stop is filled at the selected price, and markets do not promise that: a stock that gaps through the stop overnight fills lower, and a stop that was never actually placed does not exist. The calculation does not include slippage, commissions, financing, borrow costs, taxes, or portfolio-level correlation, and ten positions each risking 1% are not a portfolio risking 1%. Prices are delayed and ATR is historical. The artifact says all of this on its face, because a number that looks more certain than it is would be worse than no number.
Position size calculator FAQ
What does a position size calculator calculate?
A position size calculator divides a user-selected risk budget by the stop loss distance per share, then floors the result to a whole-share count. It answers the arithmetic behind "how many shares to buy" without recommending a security, entry, stop, or risk level.
What does the 1% rule mean in position sizing?
The 1% rule means setting the planned loss at the stop equal to 1% of the stated account value. For a $25,000 account, that produces a $250 risk budget before whole-share flooring. It is a convention, not a recommendation, and real losses can be larger if the stop is not filled at its selected price.
How do stop loss distance and ATR differ?
Stop loss distance is the absolute difference between the chosen entry and stop prices. ATR is a historical measure of recent session movement. The calculator uses stop loss distance in the share-count formula and shows ATR only as context for how that distance compares with recent movement.
What is an R multiple?
An R multiple compares the favorable distance from entry to an optional target with the distance from entry to the stop. For example, a target distance of $20 and a stop distance of $10 equals 2R before costs. R multiple describes a payoff ratio, not the probability of reaching the target.
Install the position size calculator agent skill
If your agent supports the open skills format (Claude Code, Cursor, Codex, and GitHub Copilot all do), one command installs it straight from our domain:
npx skills add https://sentisense.ai -s position-size-calculator
OpenClaw users can install it from our ClawHub publisher page, alongside the rest of the SentiSense skill family: screeners, insider and congressional trading trackers, earnings analysis, and more.
No agent at all? The data step is a single zero-dependency Node script bundled with the skill, and the three API calls behind it are documented in the API docs. An artifact costs three requests, so the free tier covers it many times over: get a free API key and the first render is a minute away.
SentiSense provides market information, sentiment analysis, and data intelligence for informational and educational purposes only. We do not provide investment advice, recommendations, or financial guidance. This calculator performs arithmetic on numbers you supply; it does not select securities, entries, stops, or amounts, and its output is not a suggestion to buy or sell any security. Users are solely responsible for their own investment decisions.