Analyst Ratings API: How to Track Price Targets and Consensus
Get analyst ratings, consensus price targets, and upgrade and downgrade actions for any covered stock from one API, in Python or straight from your coding agent, then overlay real-time sentiment to see where the crowd disagrees with Wall Street.

Analyst coverage is one of the most-used surfaces on the SentiSense API, and one of the quickest to wire into a coding agent, a script, or a dashboard. This is how to pull the consensus price target, the buy/hold/sell distribution, and the latest upgrades and downgrades for any covered stock, and how to overlay sentiment to see where the market disagrees with the analysts.
The short answer: one call to the analyst consensus endpoint returns the price-target band and recommendation for a ticker, and a second call returns the SentiSense Score, our real-time read on the same name. The gap between the two is the interesting part.
The analyst coverage that used to sit behind a premium research dashboard is now a couple of API calls your agent can make. If you can prompt a coding agent, you can build the stock analysis tool yourself: consensus, targets, revisions, and a real-time sentiment overlay, assembled in an afternoon.
What the analyst ratings API returns
The Analyst Ratings API covers a ticker four ways:
- Consensus (
/analyst/{ticker}/consensus): the price-target band (low, mean, high, median), the number of covering analysts, the implied upside to the mean target, and the buy/hold/sell distribution. - Actions (
/analyst/{ticker}/actions): recent upgrades and downgrades, so you track the direction and rate of revisions, not just the current level. - Estimates (
/analyst/{ticker}/estimates): forward EPS estimates and the earnings-surprise history. - Activity (
/analyst/activity): the same actions feed across the whole market, for scanning who is moving on what. PassactionTypes=UPGRADE,DOWNGRADE,INITIATEto skip reiterations and see only real rating changes, and note the first page (50 rows) is full data on the free tier.
The price-target band, the consensus label, and the implied upside are available on the free tier. The full buy/hold/sell distribution counts are part of the PRO tier.
Consensus rating vs crowd sentiment: the part a ratings feed leaves out
A consensus rating tells you where the sell side stands. It does not tell you whether the market agrees. SentiSense scores news and social sentiment on the same tickers in real time, so a consensus rating API call and a SentiSense Score call sit side by side in the same client. When the analysts are bullish and the Score is cooling, or the reverse, that divergence is a prompt to look closer. Tracking both from one API is the difference between knowing the rating and knowing whether the rating is already priced in.
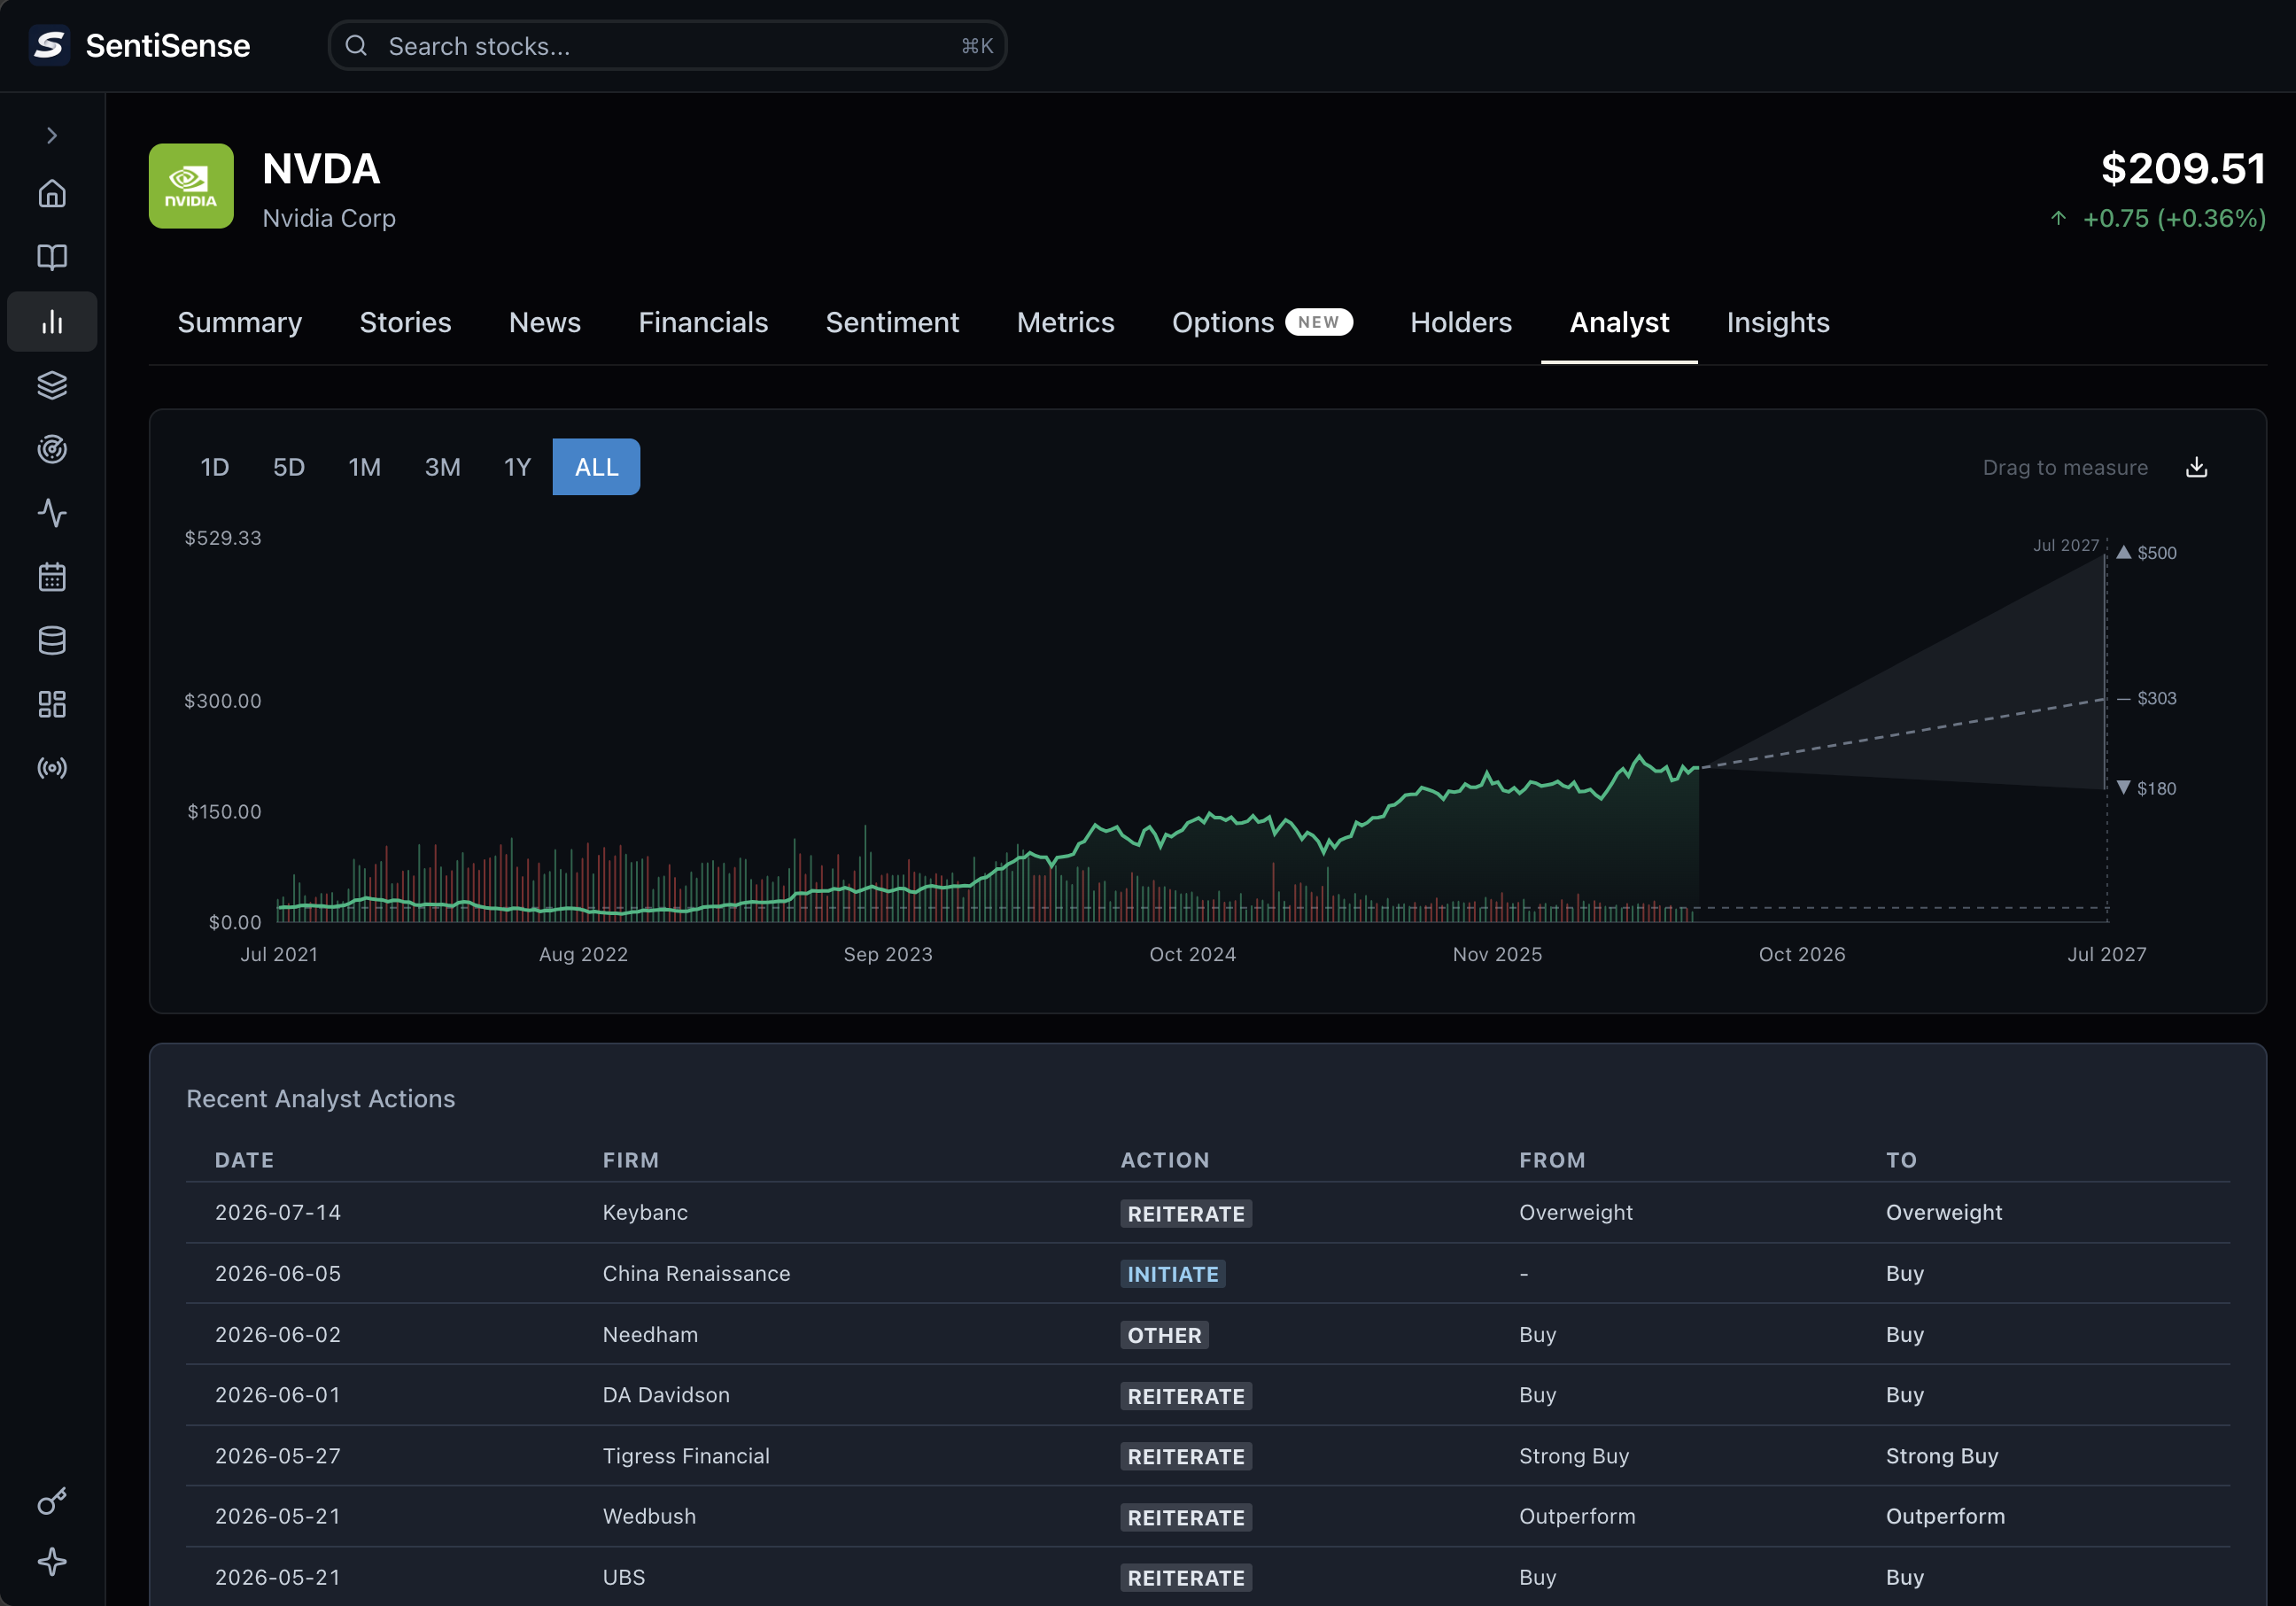
This is the consensus endpoint drawn on a chart. Every covered stock page projects the Street's low, mean, and high targets forward from the current price; the NVDA analyst tab shows it live, no sign-up required. The numbers on the right edge of the cone are the same targetLow, targetMean, and targetHigh fields the API returns.
Get analyst ratings in Python
Both calls below run on the free tier. The consensus call returns the price band and label; the metrics call returns a time-ascending series whose last point is the current SentiSense Score, our signed reading where positive is bullish, negative is bearish, and a larger magnitude means stronger conviction.
from sentisense import SentiSenseClient

client = SentiSenseClient(api_key="ss_live_YOUR_KEY")

# What the analysts say
consensus = client.get_analyst_consensus("NVDA").data
print(f"Analysts: {consensus['consensusLabel']}, "
      f"mean target ${consensus['targetMean']} "
      f"({consensus['upsidePercent']}% upside)")

# What the crowd says: the SentiSense Score (our read from news + social)
points = client.get_metrics("NVDA", metric_type="sentisense", max_data_points=30)
score = points[-1]["value"]   # latest SentiSense Score: signed, + bullish / - bearish
print(f"SentiSense Score: {score:+.1f}")

# Analysts bullish while the Score turns bearish (or the reverse) is the divergence to review
The same two calls exist in the Node SDK and over the MCP connector, so a stock analysis agent in Claude, ChatGPT, or Cursor can pull both as tools with no HTTP code. Building inside a coding agent? npx skills add SentiSenseApp/skills installs the agent skill that teaches these endpoints to Claude Code or Cursor directly.
Which tickers have analyst coverage?
Tickers without analyst coverage, which includes many small caps and most non-US listings, return a 404 rather than an empty object. Guard for it: catch the not-found case and fall back to sentiment alone, so a scan across a watchlist does not stop on the first uncovered name.
Want to track what the analysts are saying? Get a free SentiSense API key → and make your first consensus call in a few minutes.