Unusual Options Activity During the Session: Intraday Board and Large Prints
The Options Radar now runs during the session: a 15-minute delayed board of unusual contracts through the day, and the largest prints after the close.

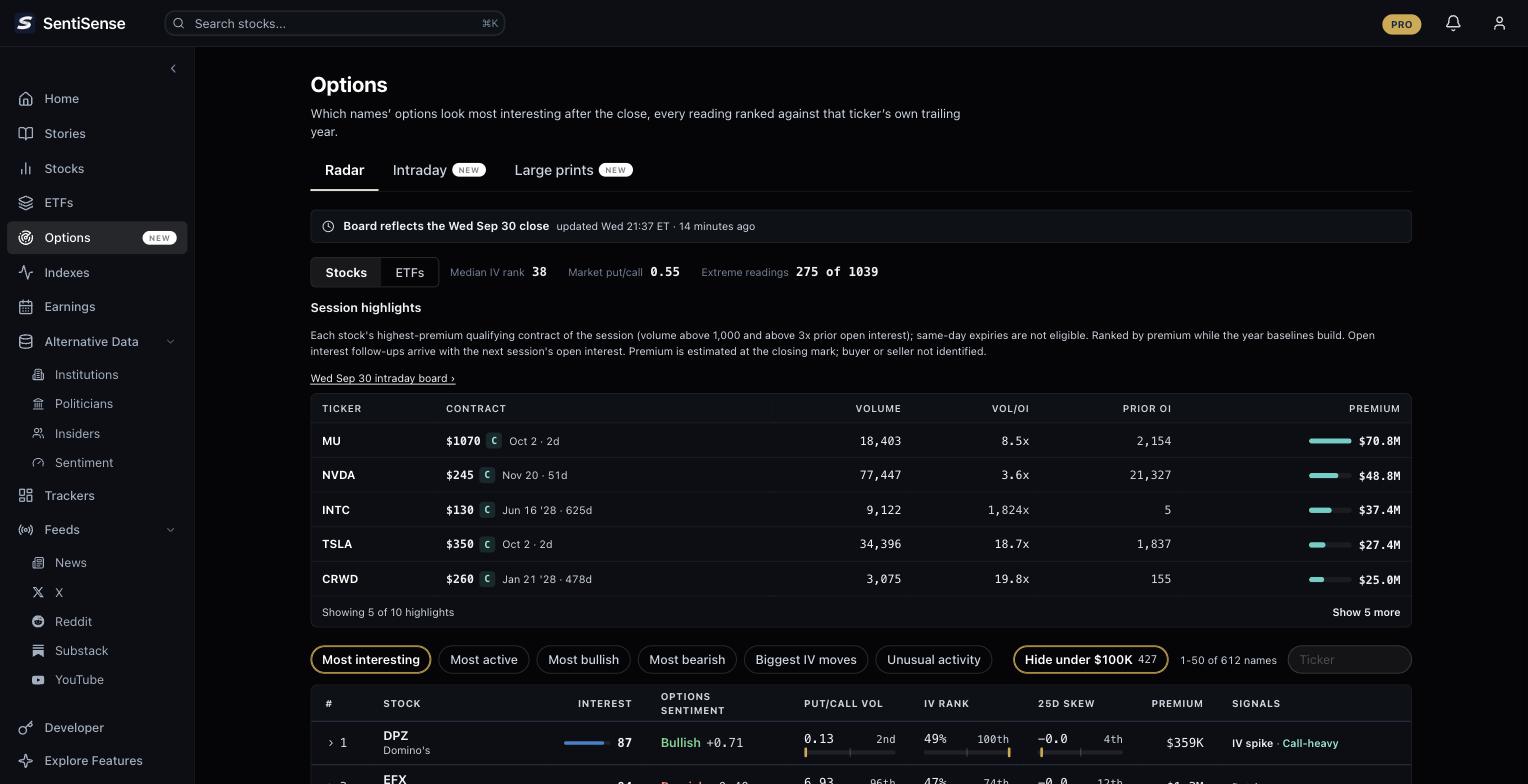
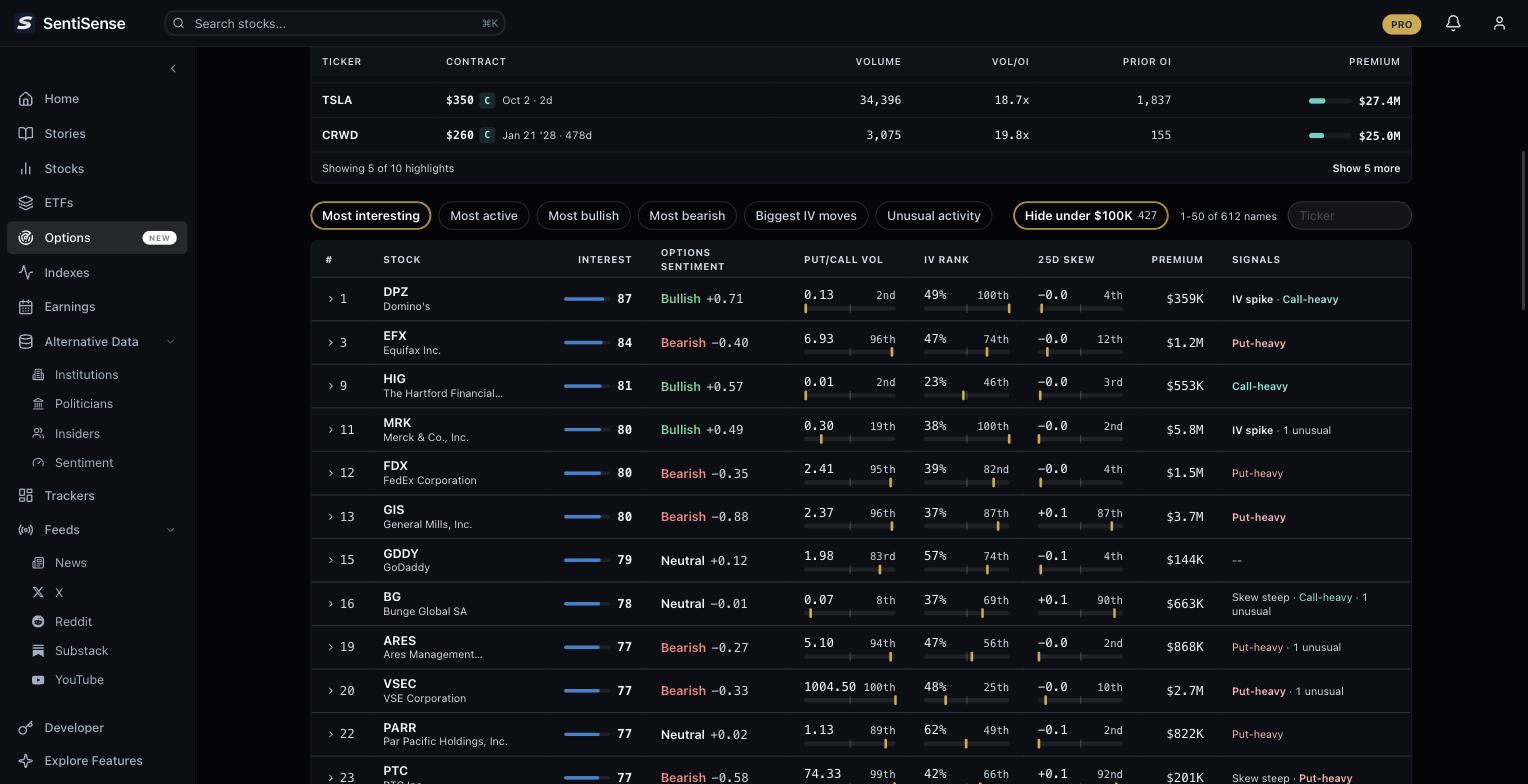
Unusual options activity used to reach the SentiSense Options Radar the next morning. From today it arrives during the session: a 15-minute delayed board of the contracts trading far above their open interest, refreshed about every 15 minutes while the market is open, and after the close, the session's largest prints rebuilt from the tape. Both are PRO features. Free accounts get the previous session's full intraday board, one day late, plus today's count of names with unusual contracts and which names are most unusual.
The July launch post covers the end-of-day Radar and how every reading is ranked against the stock's own history. This post is about what changed: the time of day.
Since October 15, 2026, the board's readings are also screenable fields and a queryable session history.
What does the intraday board show?
The Intraday tab watches a hot set of about 350 stocks (the most actively traded, plus names with recent unusual activity) and about 100 ETFs. About every 15 minutes it reads a 15-minute delayed chain for each name and flags any contract whose volume for the day has run past three times its prior open interest. Each row carries the contract, its day volume against open interest, an estimated premium, and the time the board first saw it, so a contract that showed up at 10:15 ET is still marked that way at 15:30.
The premium on the board is estimated at the mark: day volume times the mark times 100. It is a size estimate, not money paid. The board does not say whether a contract was bought or sold, because a delayed chain cannot tell you that, and we do not guess.
The board starts small after the open and grows through the day. The header always shows the time of the last refresh.
What are large prints?
After 16:45 ET each trading day, the Large prints tab publishes the session's largest options trades, rebuilt from the tape. We cluster one contract's fills that landed within seconds of each other at compatible prices into a single event, then label each event by how it executed:
- Sweep: filled across two or more exchanges within seconds, or coded as an intermarket sweep.
- Block: one fill at or above the ticker's own large single-print size.
- Split: three or more fills on a single exchange.
- Cluster: any other burst of fills close together in time and price.
- Combo: a print coded as a spread or multi-leg order, one leg of a strategy, hidden unless you include it.
Each print says how many contracts changed hands, when, across how many fills, and at what average price. It never says who was on which side. The next session's open interest is the honest way to read whether positions opened or closed, and that follow-up keeps its usual labels: opened, closed, mixed, or pending.
What does the per-stock Options tab look like now?
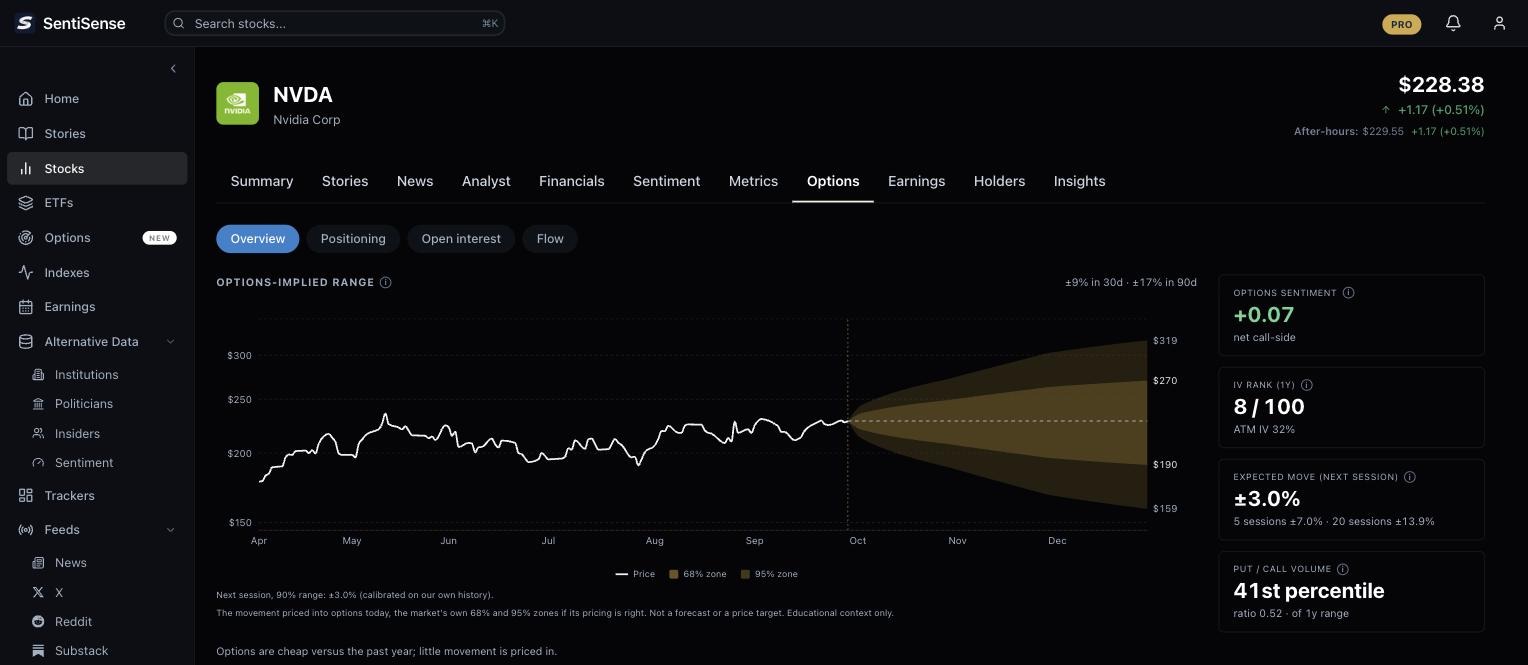
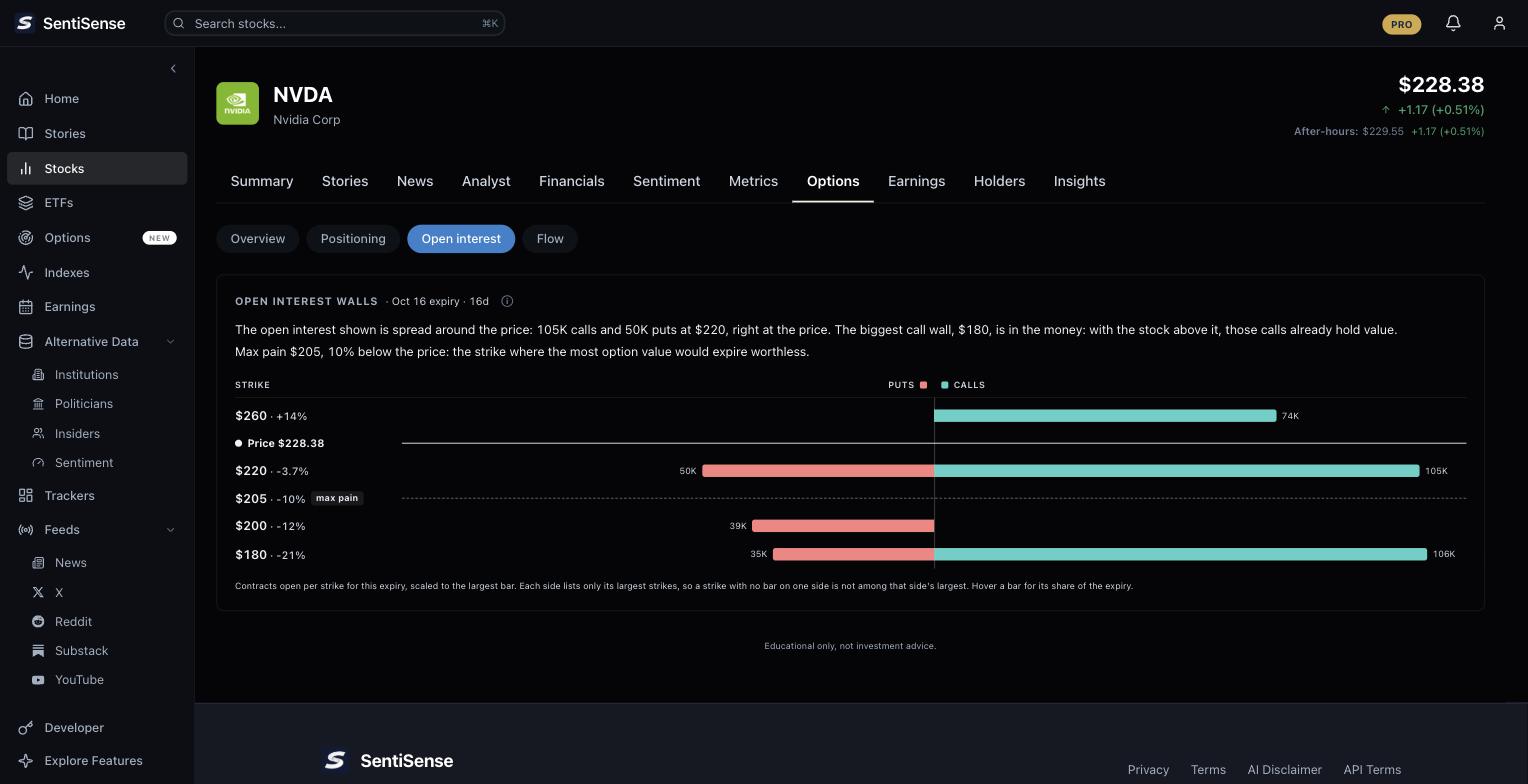
Every covered stock's Options tab is now four views:
- Overview: the options-implied range cone, IV rank against the stock's own year, the calibrated expected move for the next session, and the put/call volume percentile.
- Positioning: the put/call volume ratio and 25-delta skew charted over time, each against the stock's own history.
- Open interest: a strike ladder for the expiry shown, with the largest call and put walls, the share price, and max pain on one scale.
- Flow: today's intraday rows for that stock when it is on the hot set, the last session's end-of-day unusual contracts, and the stock's large prints over the last 20 sessions.
What do free accounts get?
The end-of-day Radar and the per-stock Options tab stay free in the app, as before. On the Intraday tab, a free account opens the previous session's board in full once the new session's first cycle lands, so you can see exactly what the board looks like a day behind the live one. Above it, the day's public facts update through the session: how many names on the hot set have an unusual contract so far, and which names are the most unusual. Large prints are PRO only.
PRO is $15 a month list. Today it is $6.75 a month, 55% off for life, and it also removes the API caps: the full Radar board, unlimited options dossiers, and full history.
For builders and agents
An API key gets the session as counts, not contract rows. GET /api/v1/options/overview now returns intradayRanking, up to 25 tickers ranked by their largest flagged contracts (by each ticker's own history once a year of baselines exists), 15-minute delayed and refreshed through the session, plus intradayActiveCount. GET /api/v1/stocks/{ticker}/options/summary returns that ticker's intradayFlow (how many unusual contracts are on its row, when the first was flagged, and the board's snapshot time) and its largePrintCount. So an agent can answer "which stocks have unusual options activity today?" and "is anything unusual in TSLA options right now?" End-of-day contract detail, the Radar board and the open-interest follow-ups were already in the API. The contract-level intraday rows and the large prints stay in the app.
The same counts are available to Claude and ChatGPT users through the options tool of the SentiSense MCP connector. The field reference is on the options API docs.
Need contract-level intraday flow or large prints through the API? Tell us what you're building.
What this is, and is not
It is a 15-minute delayed view of unusual contracts during the session, and a rebuilt record of the largest prints after it. It is not a live tape, it does not identify buyers or sellers, and it is not a trade signal. Every number says when it was read and how it was estimated.
SentiSense provides market information and options analytics for informational and educational purposes only. Intraday readings are 15-minute delayed; large prints are reconstructed from the session's tape after the close. Premium figures on the board are estimated at the mark, and no reading identifies the buyer or the seller of any contract. This product is not investment advice, is not a recommendation to buy or sell any security or options contract, and past readings are not indicative of future results. Options trading carries significant risk. Always consult a licensed financial advisor before making investment decisions.